Sometimes what is most tricky about understanding your regression output is knowing exactly what your software is presenting to you.
Here’s a great example of what looks like two completely different model results from SPSS and Stata that in reality, agree.
The Model
I ran a linear model regressing “physical composite score” on education and “mental composite score”.
The outcome variable, physical composite score, is a measurement of one’s physical well-being. The predictor “education” is categorical with four categories. The other predictor, mental composite score, is continuous and measures one’s mental well-being.
I am interested in determining whether the association between physical composite score and mental composite score is different among the four levels of education. To determine this I included an interaction between mental composite score and education.
The SPSS Regression Output
Here is the result of the regression using SPSS:
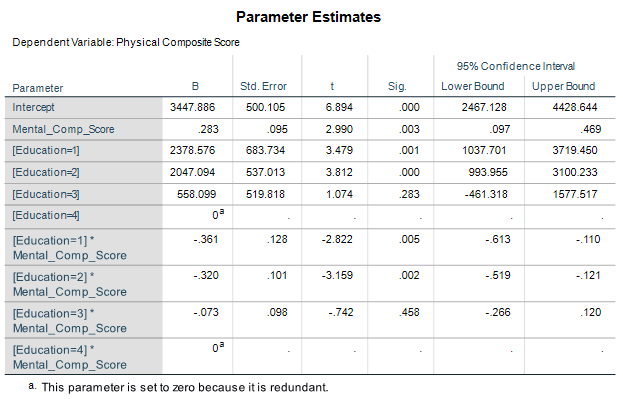
The results show that the mental composite score has a slope of 0.283 and is statistically significant at a p-value of 0.01.
The interaction with the first two levels of education, some graduate school and some college, are also significant at a p-value of 0.01. The third interaction with an education level of high school is not significant.
The Stata Regression Output
I then ran the exact same model using Stata:
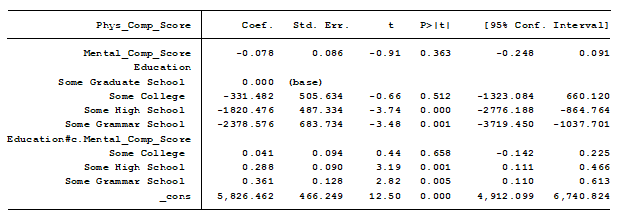
Now my slope for mental composite score is -0.078 and is insignificant. The interaction with “some college” is also insignificant.
These results don’t match the results of SPSS. Which software is correct?
It turns out they are both correct. The issue is they are not reporting the same measurements.
The Importance of the Base or Reference Category
Both SPSS and Stata are doing us a favor by dummy coding our categorical predictor, Education, for us.
This means of the four categories, one is considered the base, or reference category, and the other three are compared to that base.
The base category in SPSS is “some grammar school”. The coefficient for mental composite score of 0.283 found in the SPSS model is measuring the slope for this base category, “some grammar school”.
For a one unit change in mental composite score, the physical composite score of people with an education level no higher than grammar school increases on average by 0.283 units. The 95% confidence interval is a range of increase of 0.097 to 0.469 units.
The base category in Stata is “some graduate school”. The coefficient for mental composite score of -.078 is the slope for “some graduate school”.
For a one unit change in mental composite score, the physical composite score of people some graduate school decreases on average by 0.078 units. This parameter estimate is not significantly different from 0 since its 95% confidence interval ranges from a negative to a positive increase.
As noted, the coefficients of the interactions are different both in estimate and in significance. What exactly are the coefficients of the interactions measuring?
The coefficients of the interactions are measuring the difference in slope between the base category of education and the category of education stated in the interaction.
In the SPSS model education=1, some graduate school, has a slope that is -0.361 less than the base, “some grammar school”, whose slope is 0.283. Doing the math we find that “some graduate school” has a slope of -0.078.
The base index in Stata, “some graduate school”, has a slope of -.078. This is identical to SPSS’s calculation.
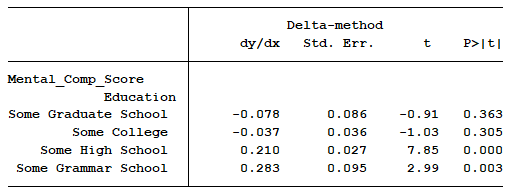
Instead of “doing the math”, we can have our statistical software calculate the slopes of each line for us.
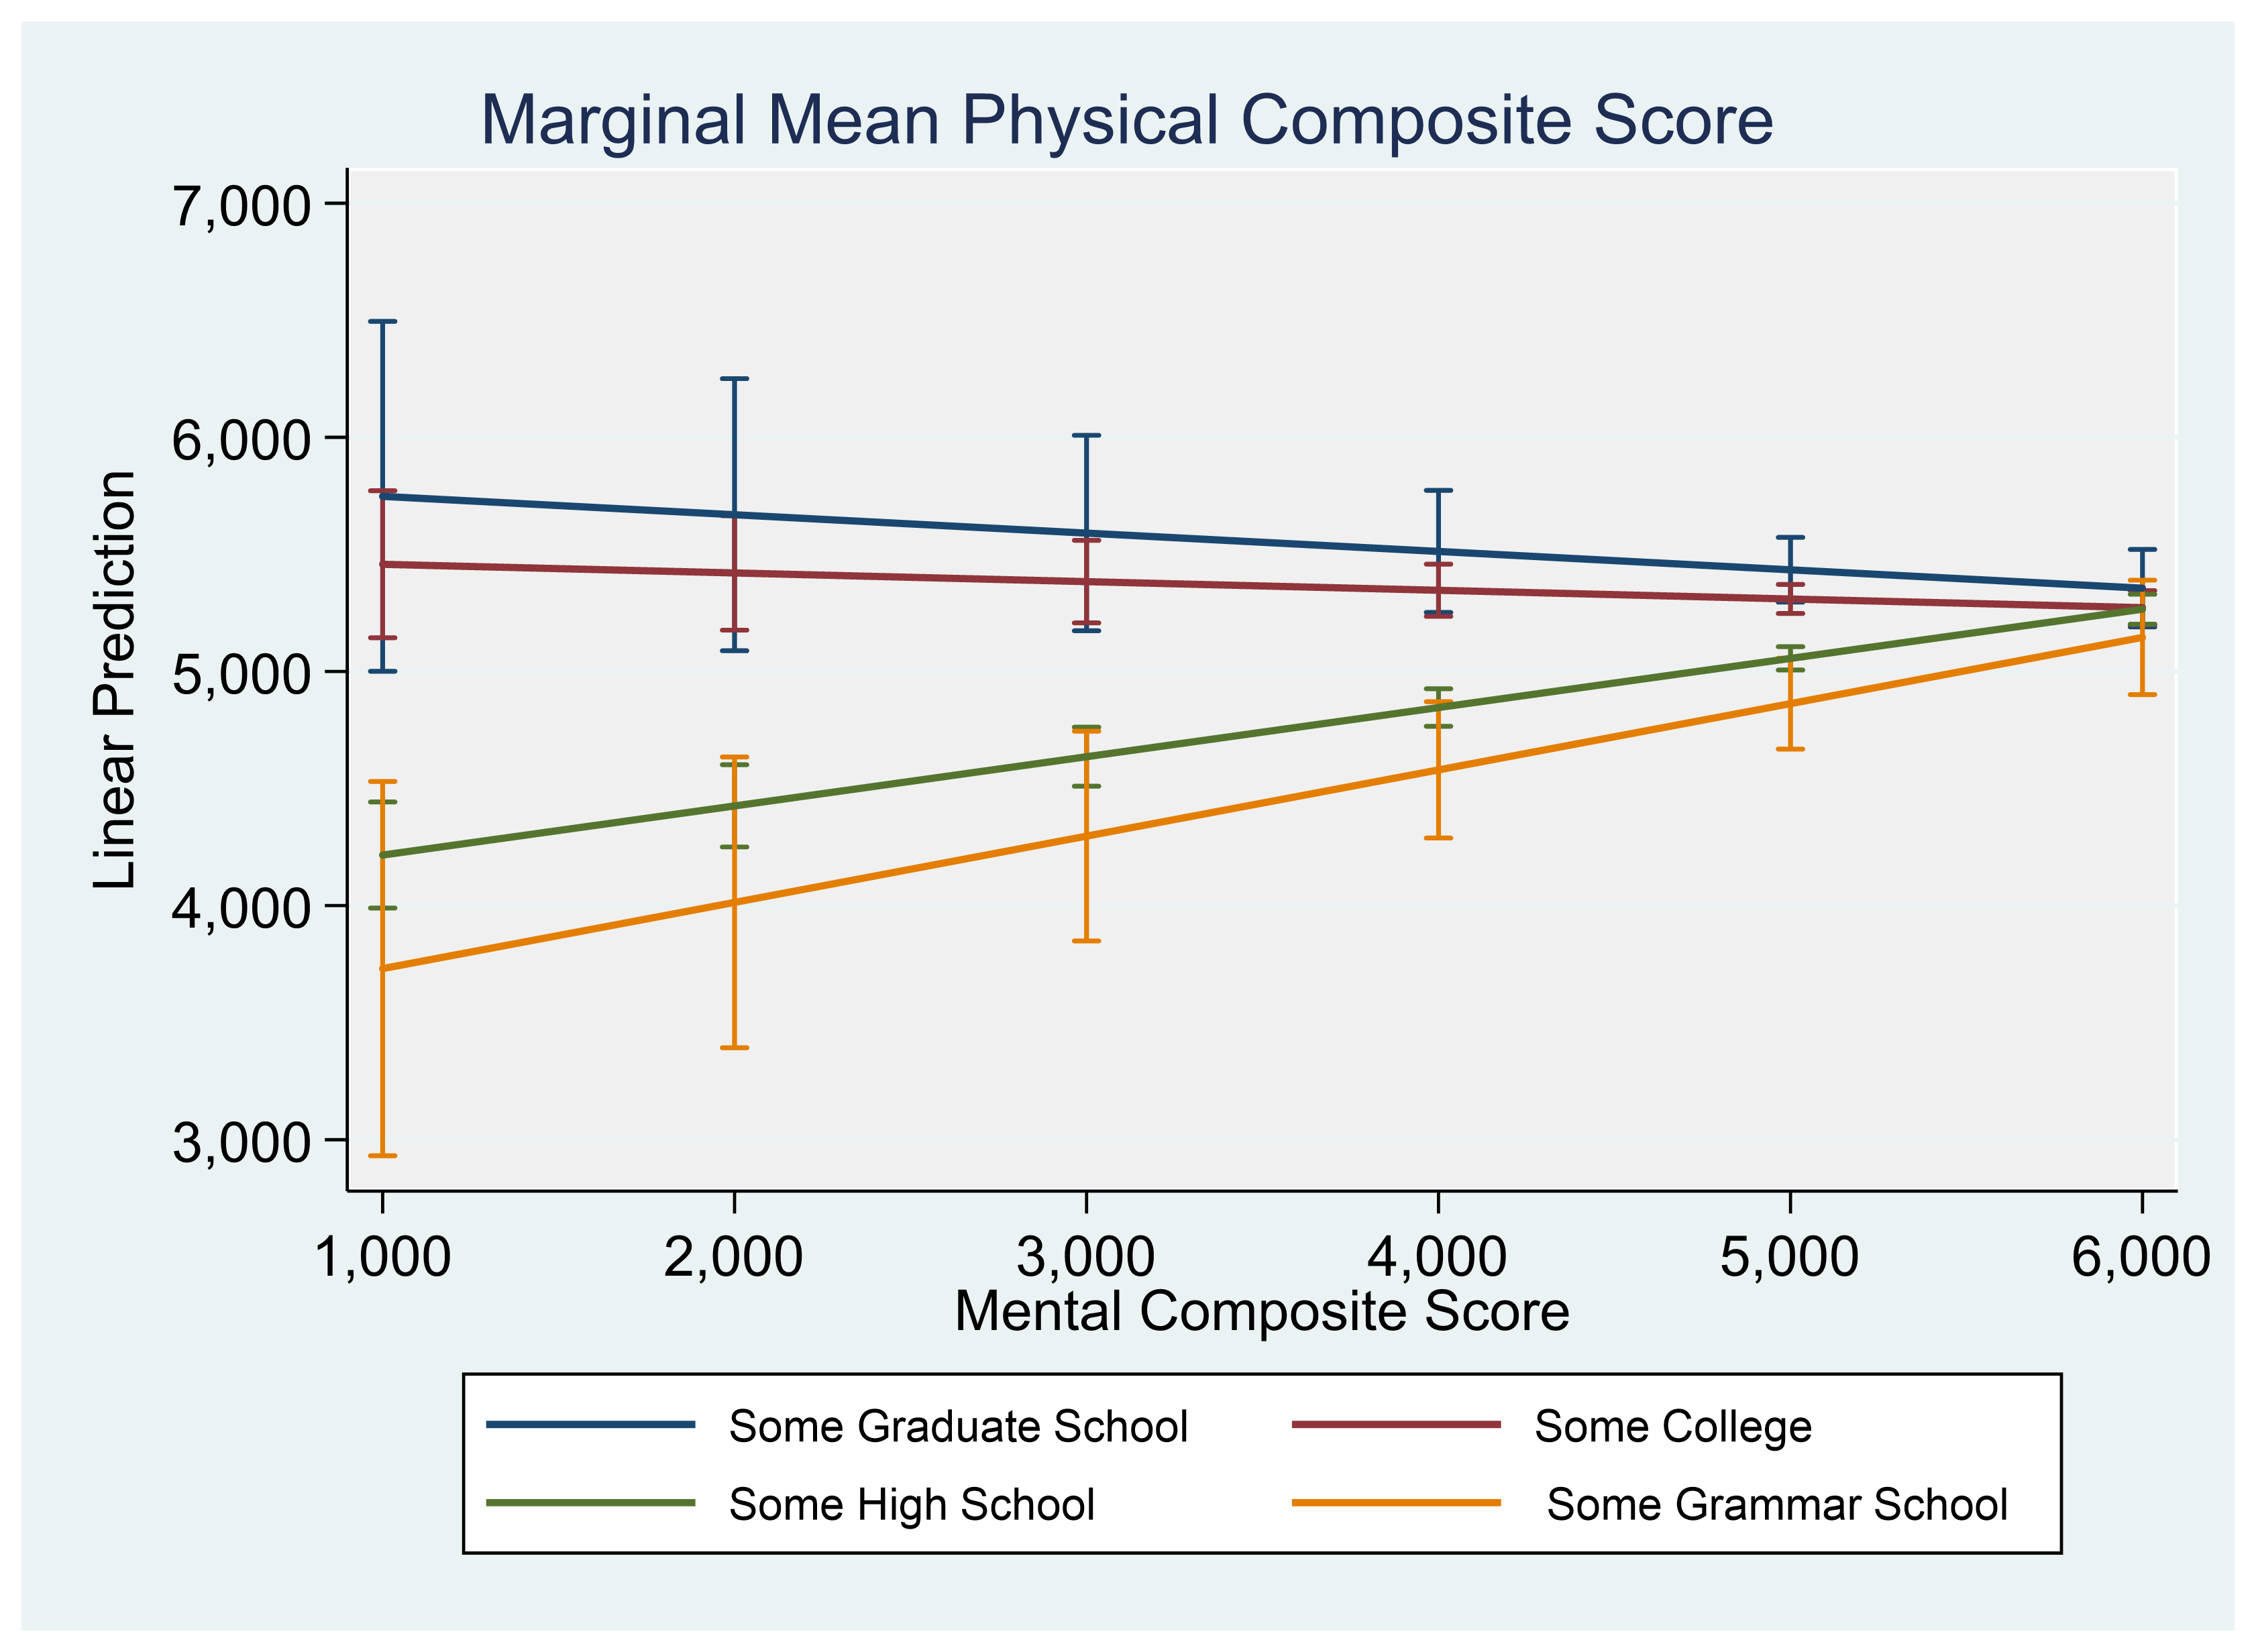
A graph can help us visualize the results.
Jeff Meyer is a statistical consultant with The Analysis Factor, a stats mentor for Statistically Speaking membership, and a workshop instructor. Read more about Jeff here.

Leave a Reply