In the last post, we examined how to use the same sample when running a set of regression models with different predictors.
Adding a predictor with missing data causes cases that had been included in previous models to be dropped from the new model.
Using different samples in different models can lead to very different conclusions when interpreting results.
Let’s look at how to investigate the effect of the missing data on the regression models in Stata.
The coefficient for the variable “frequent religious attendance” was negative 58 in model 3 and then rose to a positive 6 in model 4 when income was included. Results of model 3 alone, which didn’t control for income, leads us to conclude that frequent religious attendance is related to a lower mental health composite score (MHCS).
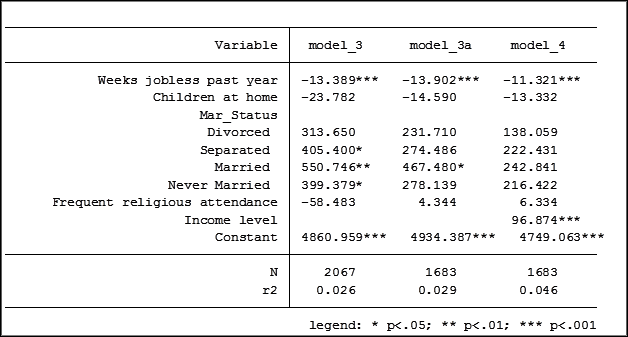
Recall that when we controlled for income our sample size decreased from 2,067 to 1,683.
So models 3 and 4 differ in two important ways: model 4 includes an additional covariate, but it also uses 384 fewer cases.
Is there a big difference between the 1,683 observations used in both models 3 and 4 and the 384 observations that were not used in model 4 but were included in model 3?
To examine the differences between the two samples I ran model 3 once more and generated a new dummy variable “in_model_3”.
gen in_model_3=e(sample)
I then created another dummy variable, which equals one if the observation is used in model 3 but not in model 4.
gen not_in_model4 =1 if in_model_3==1 & in_model_4==0
I then re-ran model 3 separately for these two groups:
- the 384 subjects who have missing income data, so are not in model 4 (titled model_3d) and
- the 1676 subjects who have full data, so were originally in both models (titled model_3e).
quietly reg MCS2000 UnemployedWksPastCal2000cont NumberBioStepAdoptChildHH2000 i.Mar_Status high_rel_attend if not_in_model4 ==1
estimates store model_3d
quietly reg MCS2000 UnemployedWksPastCal2000cont NumberBioStepAdoptChildHH2000 i.Mar_Status high_rel_attend if not_in_model4 ==0
estimates store model_3e
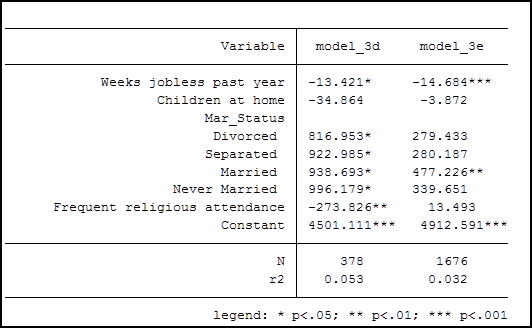
Below are the results of the two models:
The mean MHCS for the two groups are:
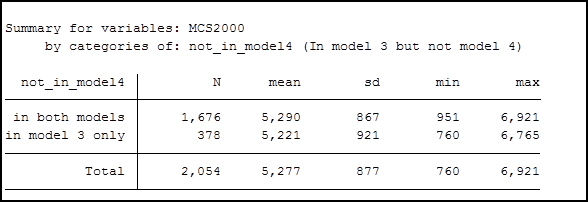
The mean MHCS for the two groups are very similar.
However, the coefficients for the variables used in the model, except for weeks jobless, are considerably different between the two groups.
That tells us that something is different between people who didn’t report their income and those who did. So we can’t just compare the coefficients across our original models—they don’t mean the same thing.
In another post, we’ll dig a little deeper into what might be going on here.
Jeff Meyer is a statistical consultant with The Analysis Factor, a stats mentor for Statistically Speaking membership, and a workshop instructor. Read more about Jeff here.

Leave a Reply