One of the most difficult steps in calculating sample size estimates is determining the smallest scientifically meaningful effect size.
Here’s the logic:
The power of every significance test is based on four things: the alpha level, the size of the effect, the amount of variation in the data, and the sample size.
You will measure the effect size in question differently, depending on which statistical test you’re performing. It could be a mean difference, a difference in proportions, a correlation, regression slope, odds ratio, etc.
When you’re planning a study and estimating the sample size needed for a specific power, you usually can’t do much about the alpha level – it’s set at .05 for most purposes.
Likewise, you can lower the amount of variation. A few options include changing the design of the study or including a key covariate, if one is available. Once you’ve done all you can to lower variation, though, you’ve got what you’ve got.
You really can’t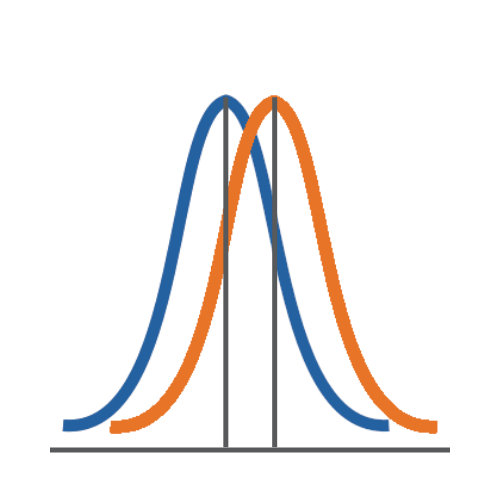 do anything to affect the effect size, other than measure the variables with as little error as possible. The effect that is in the data is the effect that is in the data.
This is why we solve for sample size – it’s the one thing, usually, within the researcher’s control.
Choosing the Effect Size to Use in the Power Calculation
As a general rule, even the tiniest effect size can be found statistically significant with a large enough sample.
At first thought, this seems good. I come up with a large enough sample and I’ll find statistical significance for the effect in my sample.
But is statistical significance always good? Do you want to be making claims that an effect exists if it’s tiny?
That’s why good sample size estimates are not based on the effect size you think you’ll find or that someone else found.
Good power calculations are based on the smallest effect that is scientifically or clinically meaningful.
This avoids that embarrassing situation when you publish your results and the response is “So what?”
This means that if the effect that exists in your data (and you can’t change) is too small to be meaningful, you won’t find statistical significance. Only effects that are large enough to be scientifically meaningful will also be statistically signifi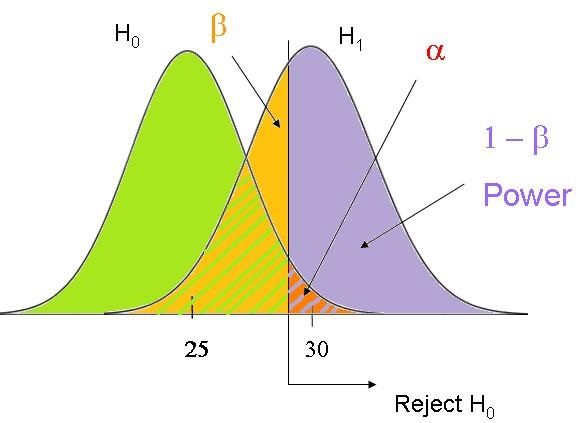 cant.
cant.
Why This Is So Hard To Figure Out
But choosing the smallest scientifically meaningful effect can be very difficult to figure out ahead of time. There are two reasons.
The first is that some scales are pretty meaningless. Effects that you measure in currency, hours, or degrees Celsius are usually easy to understand because they’re concrete and meaningful. A difference in $2000 to annual household income is easy to evaluate as being meaningful. We all have a good sense of what an extra $2000 would do to a household’s income. (Substitute the currency of your choice, if you don’t use dollars).
Now the general public may not realize that a rise in .5 degrees Celsius in the temperature of a soil core under experimental conditions is meaningful. But you, as the soil scientist, should. This is where you use your scientific knowledge.
This is why it’s the one step with which your statistical consultant can’t help you. Sure, she can define what you’re looking for, but you’re the expert here, and you need to supply the value.
It’s on those scales that are abstract and lack inherent meaning and that haven’t been used much for which the smallest meaningful effect size is difficult to define. If your intervention reduces children’s anxiety scores by 10 points, compared to a control, is that a big enough change to actually improve the children’s lives? What about 5 points? 2?
You need to know your scale well.
If it’s a brand new scale, you’re on shakier ground. You may have to think about whether a 5% improvement is enough, and translate that back to the scale. In a case like this, though, all your sample size estimates are really educated guesses. That’s fine – it’s the best you can do – as long as you remember that.
How Power Software uses Effect Size
The second reason is that even once you’ve come up with an effect size that makes sense to you, it may not be in the same terms that your sample size software uses.
For example, Study Size 2.0 allows you to define the effect size for a one-way ANOVA three ways:
- The difference between any two of k means
- The smallest difference among any of the k means
- The standard deviation of the k means
In G*Power, the only way to define the same effect in an ANOVA is through Eta-squared, the percentage of the variance in Y accounted for by the factor.
So depending on how you define and think about your effect, it can be tricky to translate it to the effect size the software wants you to input.
And once you estimate sample sizes, remember they’re just estimates. They’re only as good as the information they’re based on. If you have to guess a bit here and there, don’t take them too seriously.

Thank you for this excellent post. I realize that very often students have difficulty to grasp why the concept of effect size is important.
Well scripted to make it easily understandable. However, there are some pre-requisites before this explanation is gone through. If prerequisites for understanding are embedded at the beginning. The downside of doing that could be that too many back-hopping may happen. It is worthn a try to understand how it works.