One of the key concepts in Survival Analysis is the Hazard Function.
But like a lot of concepts in Survival Analysis, the concept of “hazard” is similar, but not exactly the same as, its meaning in everyday English. Since it’s so important, though, let’s take a look. (more…)
by Steve Simon, PhD
The Cox regression model has a fairly minimal set of assumptions, but how do you check those assumptions and what happens if those assumptions are not satisfied?
Non-proportional hazards
The proportional hazards assumption is so important to Cox regression that we often include it in the name (the Cox proportional hazards model). What it essentially means is that the ratio of the hazards for any two individuals is constant over time. They’re proportional. It involves logarithms and it’s a strange concept, so in this article, we’re going to show you how to tell if you don’t have it.
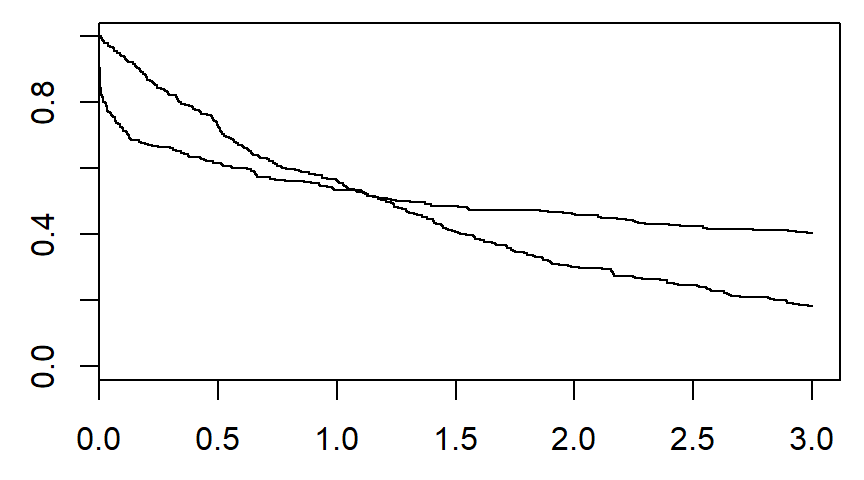
There are several graphical methods for spotting this violation, but the simplest is an examination of the Kaplan-Meier curves.
If the curves cross, as shown below, then you have a problem.
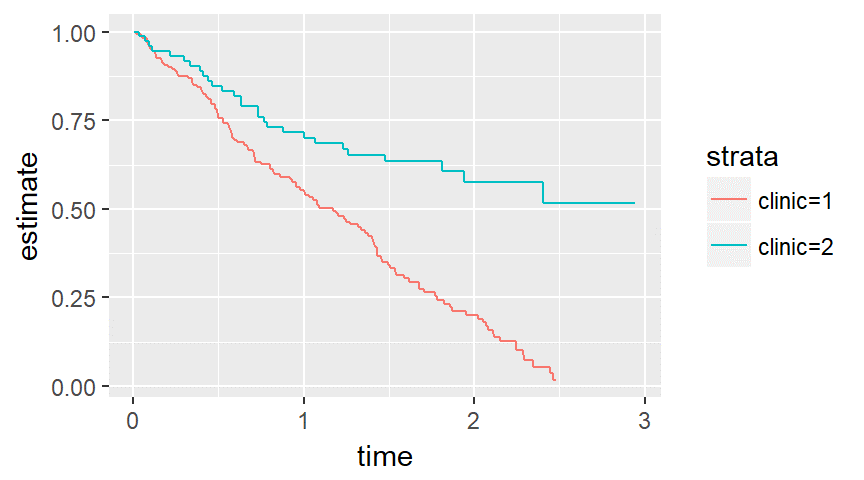
Likewise, if one curve levels off while the other drops to zero, you have a problem.
You can think of non-proportional hazards as an interaction of your independent variable with time. It means that you have to do more work in interpreting your model. If you ignore this problem, you may also experience a serious loss in power.
If you have evidence of non-proportional hazards, don’t despair. There are several fairly simple modifications to the Cox regression model that will work for you.
Nonlinear covariate relationships
The Cox model assumes that each variable makes a linear contribution to the model, but sometimes the relationship may be more complex.
You can diagnose this problem graphically using residual plots. The residual in a Cox regression model is not as simple to compute as the residual in linear regression, but you look for the same sort of pattern as in linear regression.
If you have a nonlinear relationship, you have several options that parallel your choices in a linear regression model.
Lack of independence
Lack of independence is not something that you have to wait to diagnose until your data is collected. Often it is something you are aware from the start because certain features of the design, such as centers in a multi-center study, are likely to produce correlated outcomes. These are the same issues that hound you with a linear regression model in a multi-center study.
There are several ways to account for lack of independence, but this is one problem you don’t want to ignore. An invalid model will ruin all your confidence intervals and p-values.
Linear, Logistic, Tobit, Cox, Poisson, Zero Inflated… The list of regression models goes on and on before you even get to things like ANCOVA or Linear Mixed Models.
In this webinar, we will explore types of regression models, how they differ, how they’re the same, and most importantly, when to use each one.
Note: This training is an exclusive benefit to members of the Statistically Speaking Membership Program and part of the Stat’s Amore Trainings Series. Each Stat’s Amore Training is approximately 90 minutes long.
About the Instructor

Karen Grace-Martin helps statistics practitioners gain an intuitive understanding of how statistics is applied to real data in research studies.
She has guided and trained researchers through their statistical analysis for over 15 years as a statistical consultant at Cornell University and through The Analysis Factor. She has master’s degrees in both applied statistics and social psychology and is an expert in SPSS and SAS.
Not a Member Yet?
It’s never too early to set yourself up for successful analysis with support and training from expert statisticians.
Just head over and sign up for Statistically Speaking.
You'll get access to this training webinar, 130+ other stats trainings, a pathway to work through the trainings that you need — plus the expert guidance you need to build statistical skill with live Q&A sessions and an ask-a-mentor forum.
Need to dummy code in a Cox regression model?
Interpret interactions in a logistic regression?
Add a quadratic term to a multilevel model?
 This is where statistical analysis starts to feel really hard. You’re combining two difficult issues into one.
You’re dealing with both a complicated modeling technique at Stage 3 (survival analysis, logistic regression, multilevel modeling) and tricky effects in the model (dummy coding, interactions, and quadratic terms).
The only way to figure it all out in a situation like that is to break it down into parts. (more…)