A very common question is whether it is legitimate to use Likert scale data in parametric statistical procedures that 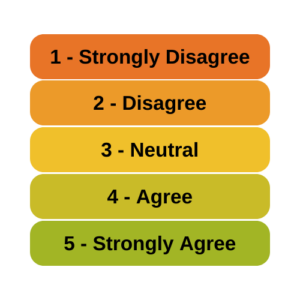 require interval data, such as Linear Regression, ANOVA, and Factor Analysis.
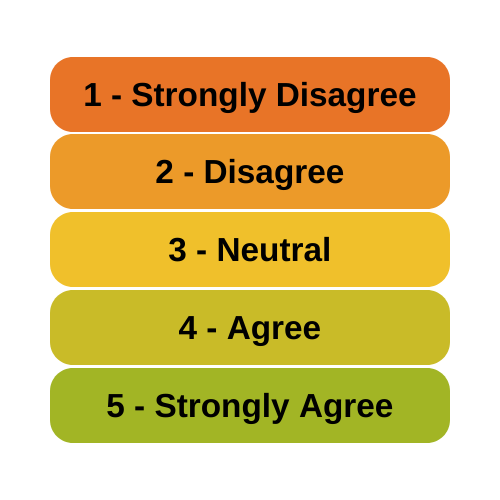
A typical Likert scale item has 5 to 11 points that indicate the degree of something. For example, it could measure agreement with a statement, such as 1=Strongly Disagree to 5=Strongly Agree. It can be a 1 to 5 scale, 0 to 10, etc. (more…)
 Is it really ok to treat Likert items as continuous?
  And can you just decide to combine Likert items to make a scale? Likert-type data is extremely common—and so are questions like these about how to analyze it appropriately. (more…)
You probably learned about the four levels of measurement in your very first statistics class: nominal, ordinal, interval, and ratio.
Knowing the level of measurement of a variable is crucial when working out how to analyze the variable. Failing to correctly match the statistical method to a variable’s level of measurement leads either to nonsense or to misleading results.
But the simple framework of the four levels is too simplistic in most real-world data analysis situations.
(more…)
Principal Component Analysis is really, really useful.
You use it to create a single index variable from a set of correlated variables.
In fact, the very first step in Principal Component Analysis is to create a correlation matrix (a.k.a., a table of bivariate correlations). The rest of the analysis is based on this correlation matrix.
You don’t usually see this step — it happens behind the scenes in your software.
Most PCA procedures calculate that first step using only one type of correlations: Pearson.
And that can be a problem. Pearson correlations assume all variables are normally distributed. That means they have to be truly (more…)
There are many types and examples of ordinal variables: percentiles, ranks, likert scale items, to name a few.
These are especially hard to know how to analyze–some people treat them as numerical, others emphatically say not to. Everyone agrees nonparametric tests work, but these are limited to testing only simple hypotheses and designs. So what do you do if you want to test something more elaborate?
In this webinar we’re going to lay out all the options and when each is (more…)
A central concept in statistics is a variable’s level of measurement. It’s so important to everything you do with data that it’s usually taught within the first week in every intro stats class.
But even something so fundamental can be tricky once you start working with real data. (more…)
 require interval data, such as Linear Regression, ANOVA, and Factor Analysis.