Have you ever had this happen? You run a regression model. It can be any kind—linear, logistic, multilevel, etc. In the ANOVA table, the effect of interest has a very low p-value. In the regression table, it doesn’t. Or vice-versa.
How can the same effect have two different p-values? In this article, let’s explore when this happens and what it means.
What the statistics in each table measures
The ANOVA table is a table of F tests. It may not be called the ANOVA table on your output, but it always includes a set of F tests. Some software procedures only give one F test for the model as a whole, but most will break it down into a series of F tests, one for each predictor variable or term in your model.
The regression coefficients table is a table of t tests. It includes each regression coefficient, along with its standard error, and usually a t test (some generalized linear models will have Wald or z tests instead, but they have the same role here).
Both tables often list out each predictor variable, along with a p-value for that variable’s conditional effect on Y.
There are two situations in which the p-values will match. Both must be true.
- The F test has one df. This happens in two situations. Either the predictor, X, is numerical or it’s categorical and binary (only two groups).
- The predictor is not involved with any interactions with a variable that is not centered at is mean.
If both of those are true, not only will the p-value match, but the t-statistic in the regression coefficients table will be the positive or negative square root of the F statistic.
An Example ANOVA Table with Matching and Unmatching Regression Coefficients
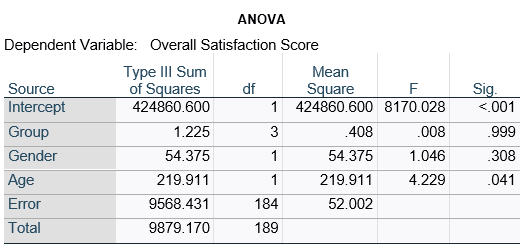
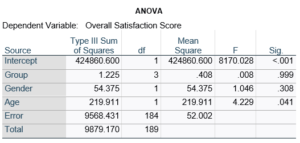
Here’s an example of an ANOVA table from a linear regression. In this example, there are four treatment groups, two genders, and age in years (measured continuously and centered at its mean). The response variable, Y, is a satisfaction score with a training. The four groups represented four learning strategies the adult learners were trained to use.
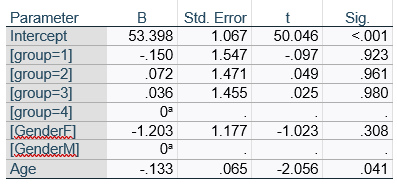
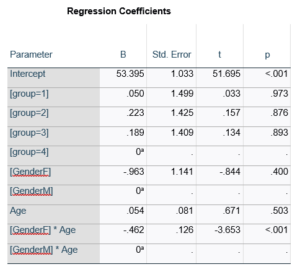
Let’s compare this to the regression coefficients table.

If you compare p-values across the two tables, you can see that Gender and Age have the same p-values, but Group doesn’t.
Gender and Age meet both conditions. Both have 1 df in the F table. Gender because it’s binary (two categories) and Age because it’s numerical). There are no interactions.
Group doesn’t match because it has 3 df in the F test. The F test is testing the null hypothesis that there is no difference among the four means. The t-tests in the regression coefficients table are testing three specific contrasts. Each one compares one group mean to the group 4 mean. For example, the group=1 coefficient tests whether the difference between the mean group 1 satisfaction score differs only from the group 4 score. It’s a different null hypothesis than the F test.
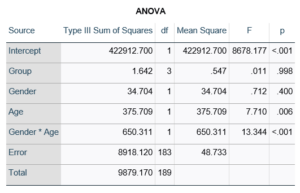
This would be the case whether or not there were interactions in the model that contain Group. Any time you have more that one df in the F test (you can see group has 3), you’ll get as many p-values in the regression coefficients as you have df in the F table. The p-values can’t match because there are more of them in the regression coefficients table.
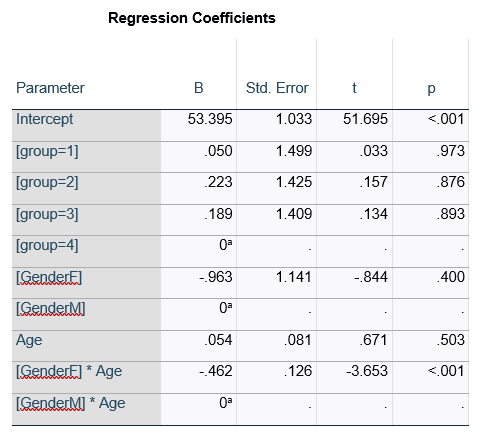
Gender, which is also categorical, does have the same p-value in both tables. It has 1 df in the F test, which tests the null hypothesis that the two gender means have no variance (they’re the same). Gender is involved in an interaction, so the only reason the hypothesis test, and therefore the p-value, is the same is because the variable it interacts with, Age, is centered.
In conclusion, most of the time, it’s fine if the results don’t match. It’s because the two tables are reporting results of different hypothesis tests, based on what’s in your model.
When interpreting the results of a regression model, the first step is to look at the regression coefficients. Each term in the model has one. And each one describes the average difference in the value of Y for a one-unit difference in the value of the predictor variable, X, that makes up that term. It’s the effect size statistic for that term in the model. (more…)

Multicollinearity is one of those terms in statistics that is often defined in one of two ways:
1. Very mathematical terms that make no sense — I mean, what is a linear combination anyway?
2. Completely oversimplified in order to avoid the mathematical terms — it’s a high correlation, right?
So what is it really? In English?
(more…)
The coefficients of count model regression tables are shown in either logged form or as incidence rate ratios. Trying to explain the coefficients in logged form can be a difficult process.
Incidence rate ratios are much easier to explain. You probably didn’t realize you’ve seen incidence rate ratios before, expressed differently.
Let’s look at an example.
A school district was interested in how many children in their sixth grade classes played on organized sports teams. So they did a count and also noted the gender of the child. The results were put into a table: (more…)
In the last post, we examined how to use the same sample when running a set of regression models with different predictors.
Adding a predictor with missing data causes cases that had been included in previous models to be dropped from the new model.
Using different samples in different models can lead to very different conclusions when interpreting results.
Let’s look at how to investigate the effect of the missing data on the regression models in Stata.
The coefficient for the variable “frequent religious attendance” was negative 58 in model 3 and then rose to a positive 6 in model 4 when income was included. Results (more…)
Count variables are common dependent variables in many fields. For example:
- Number of diseased trees
- Number of salamander eggs that hatch
- Number of crimes committed in a neighborhood
Although they are numerical and look like they should work in linear models, they often don’t.
Not only are they discrete instead of continuous (you can’t have 7.2 eggs hatching!), they can’t go below 0. And since 0 is often the most common value, they’re often highly skewed — so skewed, in fact, that transformations don’t work.
There are, however, generalized linear models that work well for count data. They take into account the specific issues inherent in count data. They should be accessible to anyone who is familiar with linear or logistic regression.
In this webinar, we’ll discuss the different model options for count data, including how to figure out which one works best. We’ll go into detail about how the models are set up, some key statistics, and how to interpret parameter estimates.
Note: This training is an exclusive benefit to members of the Statistically Speaking Membership Program and part of the Stat’s Amore Trainings Series. Each Stat’s Amore Training is approximately 90 minutes long.
About the Instructor

Karen Grace-Martin helps statistics practitioners gain an intuitive understanding of how statistics is applied to real data in research studies.
She has guided and trained researchers through their statistical analysis for over 15 years as a statistical consultant at Cornell University and through The Analysis Factor. She has master’s degrees in both applied statistics and social psychology and is an expert in SPSS and SAS.
Not a Member Yet?
It’s never too early to set yourself up for successful analysis with support and training from expert statisticians.
Just head over and sign up for
Statistically Speaking.
You'll get access to this training webinar, 130+ other stats trainings, a pathway to work through the trainings that you need — plus the expert guidance you need to build statistical skill with live Q&A sessions and an ask-a-mentor forum.