The field of statistics has a terminology problem.
It affects students’ ability to learn statistics. It affects researchers’ ability to communicate with statisticians; with collaborators in different fields; and of course, with the general public.
It’s easy to think the real issue is that statistical concepts are difficult. That is true. It’s not the whole truth, though. (more…)
I’ve written about this before–there is just something about statistics that makes people feel…well, not so smart.

This makes people v-e-r-y reluctant to ask questions.
This fact really struck me years and years ago. Hit me hard.
(more…)
One of the biggest challenges that data analysts face is communicating statistical results to our clients, advisors, and colleagues who don’t have a statistics background.
Unfortunately, the way that we learn statistics is not usually the best way to communicate our work to others, and many of us are left on our own to navigate what is arguably the most important part of our work.
In this webinar, we will cover how to: (more…)
There are many steps to analyzing a dataset. One of the first steps is to create tables and graphs of your variables in order to understand what is behind the thousands of numbers on your screen. But the type of table and graph you create depends upon the type of variable you are looking at.
There certainly isn’t much point in running a frequency table for a continuous variable with hundreds of unique observations. Creating a boxplot to look for outliers doesn’t make much sense if the variable is categorical. Creating a histogram for a dummy variable would be senseless as well.
How should you start this process? Should you create a spreadsheet listing all the names of the variables and list what type of variable they are? Should you paste the names into a Word document?
In this free webinar with Stata expert Jeff Meyer, you will discover the code to quickly determine the type of every variable in a dataset. By simply pressing the execute button on a do-file you will observe Stata placing each variable in a group (the macro) based on the type of variable it is.
You will watch, through the use of loops, Stata create the proper table and graph for each type of variable in a matter of minutes and output the data into a pdf file for future viewing. You will also receive the code to recreate and practice what you’ve learned.
**
Title: Improving Your Productivity by Unlocking the Power of Stata’s Macros and Loops
Date: Thurs, May 26, 2016
Time: 1-2 pm EDT
Presenter: Jeff Meyer
This webinar has already taken place. Please sign up below to get access to the video recording.
Jeff Meyer is a statistical consultant with The Analysis Factor, a stats mentor for Statistically Speaking membership, and a workshop instructor. Read more about Jeff here.
In Part 13, let’s see how to create box plots in R. Let’s create a simple box plot using the boxplot() command, which is easy to use. First, we set up a vector of numbers and then we plot them.
Box plots can be created for individual variables or for variables by group (more…)
I’m sure you’ve heard that R creates beautiful graphics.
It’s true, and it doesn’t have to be hard to do so. Let’s start with a simple histogram using the hist() command, which is easy to use, but actually quite sophisticated.
First, we set up a vector of numbers and then we create a histogram.
B <- c(2, 4, 5, 7, 12, 14, 16)
hist(B)
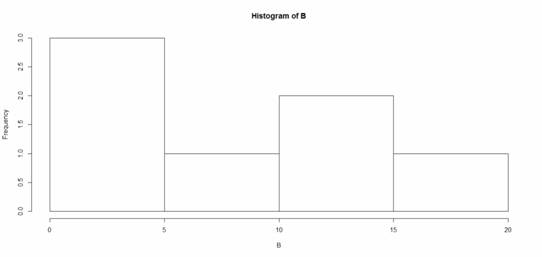
That was easy, but you need more from your histogram. (more…)