Effect size statistics are all the rage these days.
Journal editors are demanding them. Committees won’t pass dissertations without them.
But the reason to compute them is not just that someone wants them — they can truly help you understand your data analysis.
What Is an Effect Size Statistic?
 When many of us hear “Effect Size Statistic,” we immediately think we need one of a few statistics: Eta-squared, Cohen’s d, R-squared.
“… information about the magnitude and direction of the difference between two groups or the relationship between two variables.”
– Joseph A. Durlak, “How to Select, Calculate, and Interpret Effect Sizes”
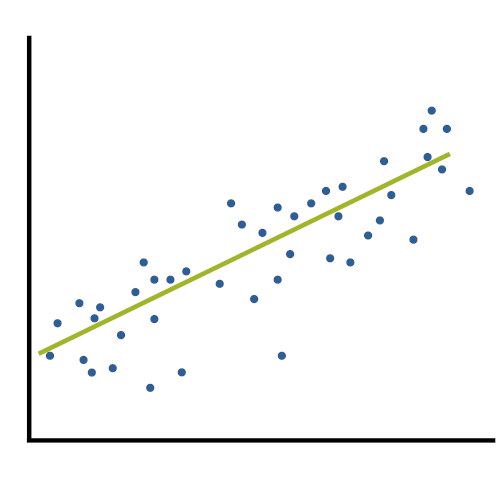
If you think about it, many familiar statistics fit this description. Regression coefficients give information about the magnitude and direction of the relationship between two variables. So do correlation coefficients.
Likewise, a simple difference between two group means fits this definition directly.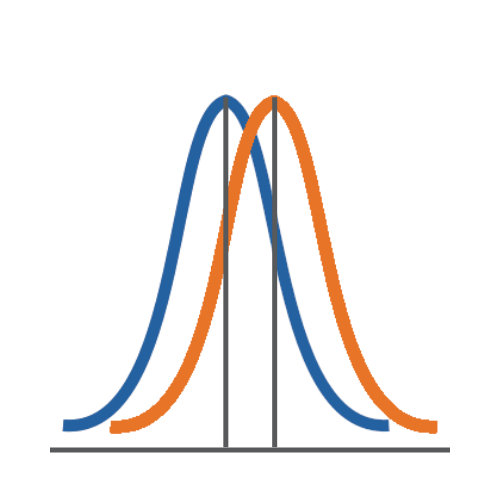
So why do we need to report specific effect size statistics?
Simple and Standardized Effect Size Statistics
There are two types of statistics that describe the size of an effect.
The first type is standardized. When most people talk about effect size statistics, this is what they’re talking about.
Standardized effect size statistics remove the units of the variables in the effect.
The second type is simple. These statistics describe the size of the effect, but remain in the original units of the variables.
So for example, say you’re comparing the mean temperature of soil under two different conditions.
The simple effect size would be the difference in the mean temperature:
Mean 1 – Mean 2.
You would interpret that statistic in degrees Celsius. For example: The mean temperature in condition 1 was 2.3 degrees higher than in condition 2.
The standardized effect size statistic would divide that mean difference by the standard deviation:
(Mean 1 – Mean 2)/Standard deviation.
You would interpret that statistic in terms of standard deviations: The mean temperature in condition 1 was 1.4 standard deviations higher than in condition 2.
Advantages and Disadvantages
While many journal editors want standardized effect sizes, they’re not always better that simple effect sizes. They have real advantages in certain situations, though.
1. Standardized effect sizes help you evaluate how big or small an effect is when the units of measurement aren’t intuitive.
Most soil scientists will have a good understanding of whether 2.3 degrees Celsius is a meaningful difference. 2.3 degrees Celsius means something because a degree is intuitive. But that’s not always the case.
Imagine a 2.3-point difference on an anxiety scale that runs from 7 to 49. Is that a meaningful difference? Well, it’s hard to tell because these points aren’t very intuitive. We’d have to have a strong understanding of the distribution of scores to see if 2.3 points was a big move, and we’d have to understand what 2.3 points really tells us about anxiety.
Sometimes standardizing the statistic — putting it into terms of standard deviations — helps remove the meaningless units and allows researchers to evaluate the effects in comparison to the full distribution of scores.
2. Standardized effect sizes can help you compare results across studies.
Many variables are measured on different scales in different studies. Again, this isn’t likely to happen with a variable like temperature, but there are multiple anxiety scales to choose from, each of which is on a different scale. Including standardized effect size statistics can help readers understand trends or differences across studies.
They’re the basis of meta-analysis, which analyzes results from a sample of studies, so reporting these statistics will benefit your colleagues.
3. Standardized effect sizes should be used in sample size calculations with great caution.
Both the smallest meaningful simple effect and a standard deviation are needed to estimate sample size statistics (given a certain alpha and desired power, among other necessary estimates). Some software requires you first to combine these two pieces of information into a standardized effect size statistic to compute the required sample size to achieve the desired power.
While there’s nothing wrong with using standardized effect sizes in these calculations, if you want good estimates, you need to go through the process of obtaining a reasonable standard deviation of your variables and thinking about what a meaningful effect would be.
Yes, this is very difficult, and there isn’t one right answer. But you are the expert in your field, and it is up to you to determine from the literature what a meaningful effect size is.
If you use generic effect size statistics for the basis of your power calculation without thinking about what it means in your study, you’ll just get a generic sample size estimate. That’s not very useful.

Leave a Reply