One issue in data analysis that feels like it should be obvious, but often isn’t, is setting up your data.
The kinds of issues involved include:
- What is a variable?

- What is a unit of observation?
- Which data should go in each row of the data matrix?
Answering these practical questions is one of those skills that comes with experience, especially in complicated data sets.
Even so, it’s extremely important. If the data isn’t set up right, the software won’t be able to run any of your analyses.
And in many data situations, you will need to set up the data different ways for different parts of the analyses. This article will outline one of the issues in data set up: using the long vs. the wide data format.
The Wide Format
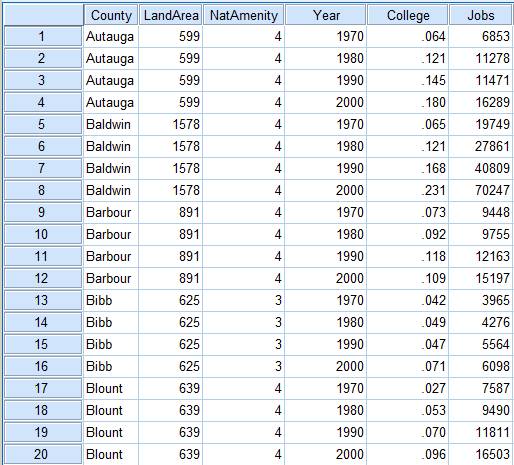
In the wide format, a subject’s repeated responses will be in a single row, and each response is in a separate column.
For example, in this data set, each county was measured at four time points, once every 10 years starting in 1970. The outcome variable is Jobs, and indicates the number of jobs in each county. There are three predictor variables: Land Area, Natural Amenity (4=no and 3=Yes), and the proportion of the county population in that year that had graduated from college.
Since land area and presence of a natural amenity doesn’t change from decade to decade, those predictors have only one variable per county. But both our outcome, Jobs, and one predictor, College, have different values in each year, so require a different variable (column) for each year.
")
The Long Format
In the long format, each row is one time point per subject. So each subject (county) will have data in multiple rows. Any variables that don’t change across time will have the same value in all the rows.
You can see the same five counties’ data below in the long format. Each county has four rows of data–one for each year.
All the same information is there; we’re just set up the data differently.
We no longer need four columns for either Jobs or College. Instead, all four values of Jobs for each county are stacked–they’re all in the Jobs column. The same is true for the four values of College.
But to keep track of which observation occurred in which year, we need to add a variable, Year.
You’ll notice that variables that didn’t change from year to year–Land Area and Natural Amenity–have the same value in each of the four rows for each county. It looks strange, but it’s okay to have it this way, and as long as you analyze the data using the correct procedures, it will take into account that these are redundant.
A Comparison of Using Wide and Long Data Formats
One reason for setting up the data in one format or the other is simply that different analyses require different set ups.
For example, in all software that I know of, the wide format is required for MANOVA and repeated measures procedures.
Many data manipulations are much, much easier as well when data are in the wide format.
Likewise, mixed models and many survival analysis procedures require data to be in the long format.
Beyond software requirements, each approach has analytical implications. For example, in the wide format, the unit of analysis is the subject–the county. Whereas in the long format, the unit of analysis is each measurement occasion for each county.
The practical difference is that when the occasion is the unit of analysis, you can use each decade’s college education rate as a covariate for the same decade’s Jobs value. In the wide format, when the unit of observation is the county, there is no way to do this. You can use any of the college rates as covariates for all years, but you can’t have decade-specific covariates.
Another implication is that in the wide format, those repeated outcomes are considered different and non-interchangeable variables. Each can have its own distribution. Each is distinct. This makes sense in the county example where each observation occurred in the same four years for every county. But if each county had been measured a different number of times, or measured in different years, this set up doesn’t make a lot of sense.
So it’s important to think about the implications before you enter data.
Luckily, converting from one to the other is generally not too difficult in most software packages. For example, you can do it with Proc Transpose in SAS or with the Restructure wizard in SPSS.
This is a good skill to practice, as it’s quite helpful to be able to switch back and forth. For example, it’s often easier to enter and manipulate data in the wide format, even if you need to analyze it in the long format.

Hi Karen, Thank you for this article.
How do you exactly set up your data to run linear, logistic and count model and others as well. How the data should be structured? What should go in the columns and what should be in the rows? I am new to regression and not having this understanding is a huge roadblock for new learners. Do you have any resources where this is explained for SAS users?
Thank you.
I don’t have anything specific for SAS users, but the set up is the same for all major stat software.
For the regression models you listed, it’s always variables in the columns and cases (individuals) in rows. Always. Where things start to get tricky is when you have longitudinal, clustered, or repeated measures data. But it doesn’t sound like you do.
Hi Karen!
I did a diary study- 2 times a day, for 5 days (one questionnaire in the morning and one questionnaire in the afternoon). The questions asked in the morning where not asked in the afternoon and vice-versa.
So, although there are 10 possible registers, all the variables only have values for 5 of these 10. For example, sleeping problems were only asked in the morning, thus I have values for register 1,3,5,7 and 9, but not for 2,4,6,8 and 10.
Problem now is that I want to test a model, but because I have full columns of NA values of the variables for certain registers, I get the error Error in lme4::lFormula(formula = sleepingproblems ~ expf2fwi + (1 + expf2fwi | :
0 (non-NA) cases
Do you have any idea how to overcome this?
I passed my data from long format to wide, but I don´t know how to test anything my data in the wide format.
Thank you!
Francisca
Hi,
The above procedure works for subjects with equal number of repetition, what about for subjects with different repetition and different time points. In my case when I export my data from kobo toolbox digital data collection tool it gives an excel file with two sheet, the one contains one-time recorded variables (baseline variables) the next sheet contains longitudinal variables in long format. Both sheet have patient id in common. To integrate the two into there is different number of repetition per subject with different data points.
So, how I can merge the two into long format, please!
If subjects have unequal number of repetitions and different time points, you need to leave it in long format.
How to merge depends a lot on your statistical software and on whether you’re using that baseline value as a covariate (different variable) or as the first value of the outcome (different row).
Thanks Karen, yes the repeated data set is already in its long format. my challenge was coinciding the baselines data set to the repeated data set into one. I planned to duplicate the baseline rows up to the number of repetition for each subjects before merging them. Do you have better a better way of coinciding rows of each subject in the long format?
Hello Karen,
When you have many lines per participant, the denominator degrees of freedom will be high. Do you know if there should be an adjustment? I am running a linear mixed effect model in spss and my denominator df is 3500. Is this what should be reported even though I only had less than 100 participants? I
Hi Ray,
Try including a random slope if you can. That will help the df.
Thanks for the response Karen. That seemed to give a more accurate representation of the degrees of freedom. Do you think there are issues if I did not include a random slope?
Hi Ray,
Results are generally more accurate all around if you do include a random slope when you can.
Hi there,
I am trying to analyse e-prime data which has 400 trials (data lines) per participant, output in long format. Could you please suggest how I might best analyse these in SPSS?
Thank you in advance for your help.
Best,
Amanda
an obvious one? –> trying to figure out an intuitive way to understand partitioning variance (starting from an “empty” model): getting stuck on the partitioning part…
if you can partition the variance in your outcome variable into “sub”variances according to different levels, then why are they named with the implication that they’re random??? why not discerned variance? or sub-variance?? analyte??? sorry, i’m just learning about mixed modeling now from you and the methods consultants of ann arbor, llc,’s HLM video series.
thanks for any “random” feedback…
Hi Ben,
The idea is that only random variables have statistical distributions. So you’re measuring the variance of a distribution.
This is actually a great, great question and will require more of an answer than I can write here. I may write the answer in this month’s newsletter. Watch for it. 🙂
karen! i just saw your response today (october 28th!) and i don’t see a newsletter archive (or blogs linked to by date…) that would allow me to go back and see what you elaborated on! how can i find the perspective i’ve waited so long for?! other than a few marbles, what am i missing???
Hello! I am requesting some more information regarding wide and long formats in SPSS and SAS. If you could point me in that direction, I would appreciate it!
Thank you!
Hey Karen! Your multilevel data workshop was so helpful to me (as is The Analysis Factor in general!) I have a question: what if I have two separate within-subjects factors nested within each other? For instance, I have four time periods nested within three conditions, which are nested within participants (that is, participants did all three conditions, four times each). I’m struggling with how to shape my data with two within-subjects factors. Should I then have 12 lines of data per participant (each participant did three conditions x four time periods nested within each condition)? Or should I have four lines of data per participant (one line for each time period, and then one column for each condition)? What do you think?
Hi Lauren,
Thanks for the kind words.
You need 12 lines of data per participant. You’ll then have two variables indicating the exact trial. One will be condition and the other will be time period. It is often helpful to just have a unique identifier 1-12 for each trial. You may or may not need it in the analysis, but I tend to prefer to have it available if needed.