We’ve looked at the interaction effect between two categorical variables. Now let’s make things a little more interesting, shall we?
What if our predictors of interest, say, are a categorical and a continuous variable? How do we interpret the interaction between the two?
Well, you’re in luck. Read on.
We’ll keep working with our trusty 2014 General Social Survey data set. But this time let’s examine the impact of job prestige level (a continuous variable) and gender (a categorical, dummy coded variable) as our two predictors. Here, gender is called “male” and is coded 1 for males and 0 for females.

We can see that, on average, men make approximately $16,285 more than women.
What we want to know is, does the gender difference in income differ based on the job prestige level? An interaction term will tell us.
So you’re probably wondering, how do we interpret these coefficients?
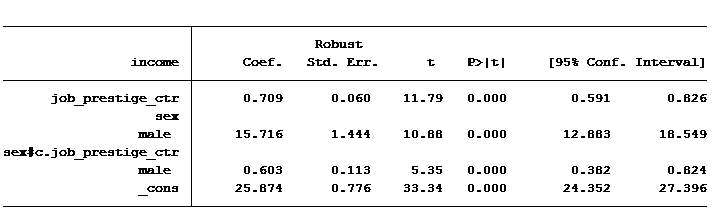
The constant tells us that women with an average prestige level job will earn $25,874. Men with an average prestige level job would expect to earn $15,716 more than women, on average $41,590.
But this gender gap of $15,716 isn’t the same for every prestige level of job. The interaction is statistically significant at a level of 0.0001.
For every 1-unit increase in job prestige score, a woman should expect to earn an additional $709, while a man should expect to earn an additional $1,312 (0.709 + 0.603).
In other words, the increase in salary for having a higher prestige job differs for men and women.
Another way to say the same thing is that the difference in salary between men and women widens as job prestige score increases.
Cue graph:
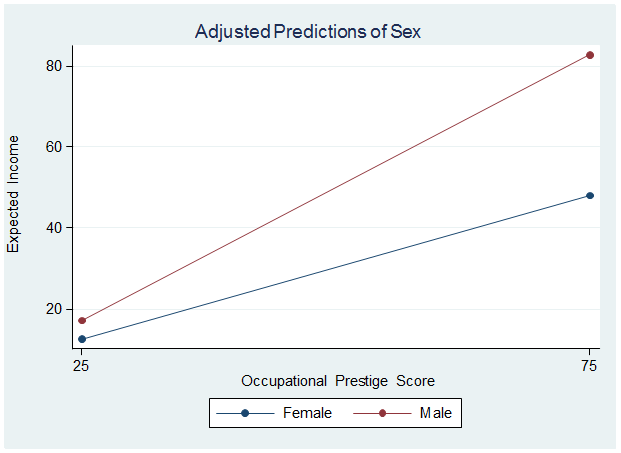
So if someone tells you that men make X amount more than women, keep in mind that the difference in income depends (in part) upon the caliber of the job. The more prestigious the job, the greater the gap, as the graph shows.
Moral of the story: When there is a statistically significant interaction between a categorical and continuous variable, the rate of increase (or the slope) for each group within the categorical variable is different.
Jeff Meyer is a statistical consultant with The Analysis Factor, a stats mentor for Statistically Speaking membership, and a workshop instructor. Read more about Jeff here.

Hi Jeff,
I have two questions: (1) how do I code the categorical variable with three levels? (2) do I need to mean-center the continuous data?
Thanks in advance!
Hi!
Do you have any material explaining how to interpret multiple categorical variables and one continuous? For instance gender, pet owner or not, live in city or not as dummy variables, job prestige as continuous and salary as your dependent variable?
Hi Tefi,
We have a whole workshop on this. But if you’re specically talking about an interation between two categorical predictors, try starting here: https://www.theanalysisfactor.com/interactions-effect-coded-predictors/
How can i show the interaction between one categorial dependent variables with two independent continuous variables?
Akash, Those are a little different as they require logistic regression for the categorical dependent variable. I’m not sure I can explain it easily in a response.
Hi Jeff,
What would happen ,if the individual explanatory variables, say prestige and men are insignificant, but the interaction is?
I have different variables but also an interaction between gender and a numeric variable
Cheers
Hi Felix,
If the interaction is significant but the individual explanatory variables are not you should still report it. An insignificant prestige means the slope for men’s prestige might be positive or negative (which is why it is insignificant). The significant interaction is telling us the difference between men and women’s slope is positive (greater) for women if the coefficient is positive or less for women if the coefficient is negative.
Hi Jeff,
I have run GLM with an interaction between continuous variable and categorical – change in weight*treatment group
There are 3 treatment groups
The dependent variable is change in heart mass
I have centred and created the appropriate dummy variables
My interaction is significant – I want to report the effect of weight in the diet treatment group. So I add the main effect value for weight to the interaction between change in weight*diet…….BUT how on earth do I calculate the corresponding confidence intervals??? A friend said you can do this in SPSS but I have been googling for the past 2 hours to no avail!
Please help i am going slowly mad!
Many tanks,
Emer
Hi Jeff,
Thank you for your post! I was wondering, how you would do this analysis, if you have gender scored as male = 0, female = 1, and other = 2. So then I would have to create 2 dummy variables, but I’m struggling to understand how to create the interaction cross product of my centered predictor variable x 2 dummies for gender. Does this work?
Best regards,
Sofia
Hi,
Thank you for an interesting post. My question is should I mean centred all the variables in my model? or just the moderator variable?
Thanks.
Rou
Hi Jeff,
How would you calculate the 95%CI for each group? You mentioned using the contrast command in R but could you provide an example on how to compute that in R?
Or how you would calculate it by hand?
I tried calculating it by hand based on the SE of the betas and the variance-covariance matrix, but I am not sure if this is correct.
Height is the predictor/exposure, sex is the modification effect (males=1, females=0).
# Beta for males: Beta(height) + Beta (height*sex)
#SE for males:
SE_m = (SE(height)^2 + SE(heightXsex)^2 + 2*cov(height*heightXsex))^(1/2)
# Then I used the SE to calculate CIs, Beta (males) +/- 1.96*SE
Thanks,
Katherine
Thank you for getting back to me. That sounds great! It is a fantastic article that helps me, much indeed Information. Keep on posting.
Hi Jeff,
Im trying to analyse my data. My variables are extraversion score, cooperative+competitive score and Socio Economic status (High and Low). I assume I would need to make the SES a dummy variable. I was also Just wondering how you got your graph 😉
Thanks
Kate
Hi Kate,
If your SES variable is already dichotomous (1,2 ) there is no need to change it to 0,1 unless you are using SPSS “Regression” command. If you use the UNIANOVA command you are fine. If you are using Stata, R or SAS you are okay using a factor variable coded 1,2. You need to set your variable as a categorical (known as a factor or indicator in some software packages). From there create your interaction and then run the model.
The graph was created in Stata using the “marginsplot” command. I have found Stata to be one of the best softwares for graphing model results. It’s very easy and produce excellent quality graphs.
Jeff
Hi Jeff,
Thank you for getting back to me. That sounds great, I will have a little play around with what you have told me. I am currently using SPSS so I will have to have a look into that on how to create the graph.
Many thanks for your help
Kate
Hi,
How did you make that Cue graph?
good explanation. If before adding interaction, there is no significant for male, but after adding interaction, there is significance for male, how to interpret it in your example?
Hi David,
In this example we are using the interaction to determine whether the slope for job prestige is different between males and females. If the data is fairly balanced between males and females I wouldn’t expect the parameter estimate for “males” to be different by much between the two models.
If we had an interaction between 2 categorical variables then the results could be very different because male would represent something different in the two models. For example if the two categories were gender and marital status, in the non-interaction model the coefficient for “male” represents the difference between males and females. In the interaction model male represents the difference between male and females for the base category of marital status. In which case “male” represents a different parameter estimate between the two models.
Jeff
Hi Jeff, Thanks for your reply. My last question is If we have one categorical with three groups(male=reference, female, transgender) and one continuous predictor (prestige level), after adding with interaction terms, p value for female become significant and also female* prestige, how to explain it? Does it mean something wrong with the analysis?
It most likely means that there is less unexplained variance in the model by including the interaction and as a result the simple effect of female has become significant. Most importantly, you should check the effect size to see how your predictors have changed when adding the interaction.
Thanks Jeff for your explanation, but I think you made a mistake. You say:
“The constant tells us that women with an average prestige level job will earn $25,874. Men with an average prestige level job would expect to earn $15,716 more than women, on average $41,590.”
But these values are not for an average prestige level job; they are for a job with a prestige level of zero. Your statement becomes true only when the job prestige level variable is transformed such that it is centered around its mean; i.e., the mean becomes zero.
Hi Ahmad,
Thanks for your comments and attention to detail. I failed to point out that I had centered job prestige score. If you look at the 2nd table you will see that I used the extension “_ctr”. I typically add this whenever I center a continuous variable. In the first table it is cut off and is not obvious. If the variable was not centered your statement is definitely accurate.
Hi,
one question: how do you calculate the interaction term in this case? Do you just multiply the categorical variable gender (0 or 1) with the continuous variable job prestige level?
In this case the interaction term will take either the value 0 (for females) or the value of the job prestige level (for males).
Is is ok to construct the interaction term just by multiplying the two variables like that?
I am asking because I have a very similar case and I didn’t know how to go about. Thanks so much for answering,
Hi Silvia,
Yes you can create an interaction by generating a new variable which is the product of a dummy variable times the continuous variable. But it is easier to let the software do it in your model. In SPSS in the UNIANOVA command you would add a new predictor such as job_prestige*gender. If you are using Stata it is job_prestige#gender. In R I believe it would be job_prestige:gender. Be sure to also include the two individual predictors of the interaction, such as job_prestige and gender, in the model.
Jeff