Adding interaction terms to a regression model has real benefits. It greatly expands your understanding of the relationships among the variables in the model. And you can test more specific hypotheses. But interpreting interactions in regression takes understanding of what each coefficient is telling you.
The example from Interpreting Regression Coefficients was a model of the height of a shrub (Height) based on the amount of bacteria in the soil (Bacteria) and whether the shrub is located in partial or full sun (Sun). Height is measured in cm, Bacteria is measured in thousand per ml of soil, and Sun = 0 if the plant is in partial sun, and Sun = 1 if the plant is in full sun.
The regression equation was estimated as follows: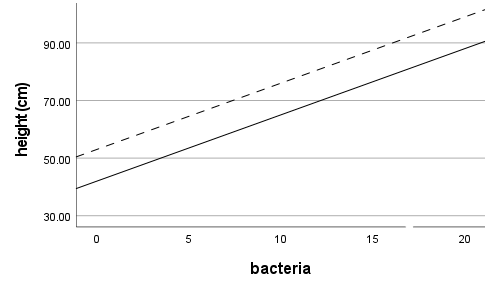
Height = 42 + 2.3*Bacteria + 11*Sun
How adding an interaction changes the model
It would be useful to add an interaction term to the model if we wanted to test the hypothesis that the relationship between the amount of bacteria in the soil on the height of the shrub was different in full sun than in partial sun.
One possibility is that in full sun plants with more bacteria in the soil tend to be taller. But in partial sun plants with more bacteria in the soil are shorter.
Another is that plants with more bacteria in the soil tend to be taller in both full and partial sun. But the relationship is much more dramatic in full than in partial sun.
The presence of an interaction indicates that the effect of one predictor variable on the response variable is different at different values of the other predictor variable. Adding a term to the model in which the two predictor variables are multiplied tests this. The regression equation will look like this:
Height = B0 + B1*Bacteria + B2*Sun + B3*Bacteria*Sun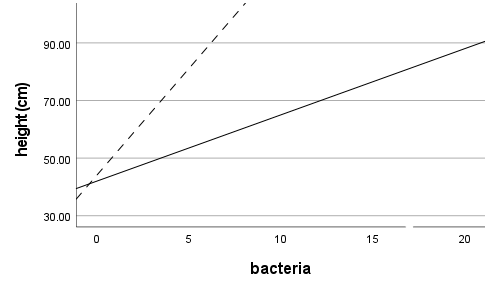
Adding an interaction term to a model drastically changes the interpretation of all the coefficients. Without an interaction term, we interpret B1 as the unique effect of Bacteria on Height.
But the interaction means that the effect of Bacteria on Height is different for different values of Sun. So the unique effect of Bacteria on Height is not limited to B1. It also depends on the values of B3 and Sun. The unique effect of Bacteria is represented by everything that is multiplied by Bacteria in the model: B1 + B3*Sun. B1 is now interpreted as the unique effect of Bacteria on Height only when Sun = 0.
Interpreting the Interaction
In our example, once we add the interaction term, our model looks like:
Height = 35 + 4.2*Bacteria + 9*Sun + 3.2*Bacteria*Sun
Adding the interaction term changed the values of B1 and B2. The effect of Bacteria on Height is now 4.2 + 3.2*Sun. For plants in partial sun, Sun = 0, so the effect of Bacteria is 4.2 + 3.2*0 = 4.2. So for two plants in partial sun, we expect a plant with 1000 more bacteria/ml in the soil to be 4.2 cm taller than a plant with less bacteria.
For plants in full sun, however, the effect of Bacteria is 4.2 + 3.2*1 = 7.4. So for two plants in full sun, a plant with 1000 more bacteria/ml in the soil would be expected to be 7.4 cm taller than a plant with less bacteria.
Because of the interaction, the effect of having more bacteria in the soil is different if a plant is in full or partial sun. Another way of saying this is that the slopes of the regression lines between height and bacteria count are different for the different categories of sun. B3 indicates how different those slopes are.
Interpreting B2 is more difficult. B2 is the effect of Sun when Bacteria = 0. Since Bacteria is a continuous variable, it is unlikely that it equals 0 often, if ever. So B2 can be virtually meaningless by itself.
Instead, it is more useful to understand the effect of Sun, but again, this can be difficult. The effect of Sun is B2 + B3*Bacteria, which is different at every one of the infinite values of Bacteria. For that reason, often the only way to get an intuitive understanding of the effect of Sun is to plug a few values of Bacteria into the equation to see how Height, the response variable, changes.

Thanks so much for the great explanations!
Suppose I am interested in studying the effects of being rich on a target variable (how much income redistribution a tax payer demands) in two different countries, C1 and C2.
I suppose it is legitimate to fit the following model:
y=B0 + B1*Country_2+B2*Country_1*Rich+B3*Country_2*Rich+B4*(All_Other_Covariates)+error
B0 measures the effect of being non-rich in Country 1 (net of all other covariates);
B1 measures the difference of the effect of being non-rich in Country 2 compared to Country 1;
B2 measures the difference of being rich in comparison to being non-rich in Country 1
B3 measures the difference of being rich in comparison to being non-rich in Country 2
If I want to test whether rich people in the two different countries are different with respect to y, am I allowed to run this test:
B1+B3-B2
(I would use the lincom test in stata)
Does the inclusion of all the other covariates affect the interpretation of the test?
Would you recommend running two different models, one for rich and one for non-rich?
So many thanks!
Hello,
Thanks so much for a clear explanation and an intuitive example. Did you use arbitrary numbers here or was there a toy dataset you used for this example? If you are willing to share it, I would like to practice using your toy dataset. Thank you!
Hi Caitlin,
These are made up numbers. No data set. 🙂
Hi Ms. Grace-Martin,
Thank you ! It was really well explained.
Best,
Matthieu
Hi Karen,
Very helpful explanation!!.
Quick question:
You say: “Interpreting B2 is more difficult. B2 is the effect of Sun when Bacteria = 0. Since Bacteria is a continuous variable, it is unlikely that it equals 0 often, if ever, so B2 can be virtually meaningless by itself”
But can I look at it as B2 is the marginal change in the outcome per unit increase in the sun (given no change in bacteria)?
Em
can you explain how you compute the confidence interval for the total effect
Could you explain how to add interaction term to the regression by hand? I wonder how to find b3 when interaction term was added
Hi Karen,
Please how would this be different if the Parameter estimates were standardized? Would the calculations still be the same?
Thank you.
Anoruo Asilonu
The explanation really helped me. Very well written.
Perfect explanation,
Thanks
Karen,
thank you for explaining this matter.
kindly correct me if I am wrong.
in order to interpret a regression coefficient, we should first check for it to be significant.
assume sun is 1. I am wondering how we should check for the significance of(b1+b3).
can we still interpret the sum if either of b1 or b3 are not significant?
Thank you,
Hi Saeed,
Generally yes, but it’s a little bit philosophical.
If the slope of the second regression line (which would be b1+b3) is of theoretical interest and you want to test whether it’s different than 0, then yes, you could check it’s significance.
The way it’s set up by default, as described above, is to give you a p-value for the difference in the two slopes, as it’s often of interest to test if the two slopes are the same or different. It’s a different research question than testing if each is different from 0.
Hi,
I was wondering if you could include an can you include an interaction variable with a log variable?
Thanks,
Hi Sarah,
Yes! It’s harder to interpret, but you can certainly do it and should in many models.
Hi Karen, the effect of Bacteria will be 4.2+3.2*1=7.4 if sun=1… My doubt is what happens to the coefficiente 4.2+3.2*1 if the variable bacteria is not significant. the coefficient will be still 4.2+3.2=7.4 if sun=1. how should i interpret that? and what will be the coefficient of bacteria if sun=1
Thank you in advance!
Karen-
I have a question I am hoping you can help me with. What if including an interaction term in a linear regression creates multi-collinearity issues? I’ve even tried centered the continuous variables (it’s a gender interaction so one term is categorical). Can I exclude the main effects and just include the interaction term to determine if there is an interaction?
hi Karen,
Goad approach for regression interaction but can this model be extended to quantile regression?
Hello,
In your example there are only 2 independent variables, so the interaction is obvious, being the product of those 2 independent variables (x1*x2).
What if you had 3 variables, but you are not sure which and which had interaction (although you suspect there is some)? Would you add to the table of values the columns X1X2X3, X1X3, X2X3?
Thanks.
You should mention the opportunity to de-mean bacteria, so the interpretation of bacteria = 0 would actually make sense.
How can we interpret the odds ratio for the following case:
Suppose we are modeling the dependency of birth-weight (dependent variable; normal/ Low) on birth term (independent variable; premature/ fullmature).
Variable B S.E. Wald P Exp(B)
Birth Term(premature): -3.099 1.079 8.248 .004 .045
For example:
Height = 35 + 4.2*Bacteria + 9*Sun + 3.2*Bacteria*Sun
What is the 9 for sun and 3,2 for bacteria*sun are significant, but 4,2 for bacteria is not significant. How do I have to interpret that?
It wouldn’t change the interpretation. It just means that when there isn’t sun (the reference condition), there is no significant effect of bacteria.
How would this apply in a logistic regression model? I am trying to calculate the OR of main effects and significant interactions.
Thank you
hello,
please help me interpret this regression equation with interaction variables.
stock price = 2 + 0.3*book values + 0.4*earnings + 0.36*book values*earnings*firm size + 0.1* firm size.
how does “0.36*book values*earnings*firm size” differ from ” 0.1* firm size ” in explaining the dependent variable?
Could you please explain how can I test the interaction using ‘likelihood ratio test’ and wald test?
Hi Karen,
thank you for this posting, which explains very well how to interpret interactions in linear models. I wonder whether it is similar in generalized linear models? Would I simply use the same estimates (log odds) and the same formulae shown above to see the effect of a moderating covariate on another predictor? And if yes, then I could simply transform the result (in your example, the value of “Height”) into odds ration via exp() or calculate probabilities? If so, I could easily plot “probability curves” of interaction terms (one curve for main effect, one curve for moderating interaction on main effect) in logistic regressions…
Best, Daniel
Hi Daniel,
The general approach is similar in generalized linear models. They of course, are a little trickier because odds ratios, for example, are ratios, not differences. See this: https://www.theanalysisfactor.com/complicated-models-with-tricky-effects/
And yes, you can plot predicted probabilites to see the interaction effect–it makes interpretation of the interaction much, much easier.
Hi, You interpreted interaction term with an example very nice, thank you. But how do you interpret a quadratic term in a nonlinear regression? Thank you very much in advance.
Hi a, just in case you still need to know (or for anyone else reading), i’m no expert but I believe this is how it works:
If the “Sun” variable was zero, then every unit of bacteria would affect the height by 4.2 units. (just b2)
if Sun was one, then every unit of bacteria would affect the height by (4.2-4.2) = 0 units. That is, b2+b3*sun (where sun is 1). The result can be interpreted as follows: when there is (full) sun, bacteria has no statistically significant effect on height.
The “interaction” identifies how the relationships between the two independent variables change their relationships with the dependent variable.
Cheers, James
Hi Karen,
how would you interpret it, say, if your coefficient for the interaction effect Bacteria*Sun were negative, such that it “cancelled out” the main effect in a sense? E.g., if the coefficient for Bacteria is 4.2, and for Bacteria*Sun it is -4.2? If these coefficients were both significant, that just seems to make no sense to me.