One question that seems to come up pretty often is:
Well, let’s start with how they’re the same:
Both are types of generalized linear models. This means they have this form:
![]()
Both can be used for modeling the relationship between one or more numerical or categorical predictor variables and a categorical outcome.
Both have versions for binary, ordinal, or multinomial categorical outcomes. And each of these requires specific coding of the outcome. For example, in both logistic and probit models, a binary outcome must be coded as 0 or 1.
So logistic and probit models can be used in the exact same situations. How do they differ?
The real difference is theoretical: they use different link functions.
In generalized linear models, instead of using Y as the outcome, we use a function of the mean of Y. This is the link function.
A logistic regression uses a logit link function:
And a probit regression uses an inverse normal link function:
![]()
These are not the only two link functions that can be used for categorical data, but they’re the most common.
Think about the binary case: Y can have only values of 1 or 0, and we’re really interested in how a predictor relates to the probability that Y=1. But we can’t use the probability itself as the function above. There are two big reasons:
1. Probability can only have values between 0 and 1, whereas the right hand side of the equation can vary from -∞ to ∞.
2. The relationship between probability and the predictors isn’t linear, it’s sigmoidal (a.k.a., S-shaped).
So we need a function of the probability that does two things: (1) converts a probability into a value that runs from -∞ to ∞ and (2) has a linear relationship with the Xs. Probit and Logistic functions both do that.
The difference in the overall results of the model are usually slight to non-existent, so on a practical level it doesn’t usually matter which one you use.
The choice usually comes down to interpretation and communication.
Interpretation:
Anyone who has ever struggled to interpret an odds ratio may find it difficult to believe that a logistic link leads to more intuitive coefficients. Because we can back transform those log-odds into odds ratios, we can get a somewhat intuitive way to interpret effects.
With a probit link, it’s not so easy. After all, what does that inverse normal really mean?
Remember back to intro stats when you had to look up in Z tables the area under the normal curve for a specific Z value? That area represents a cumulative probability: the probability that Z is less than or equal to the specified Z value.
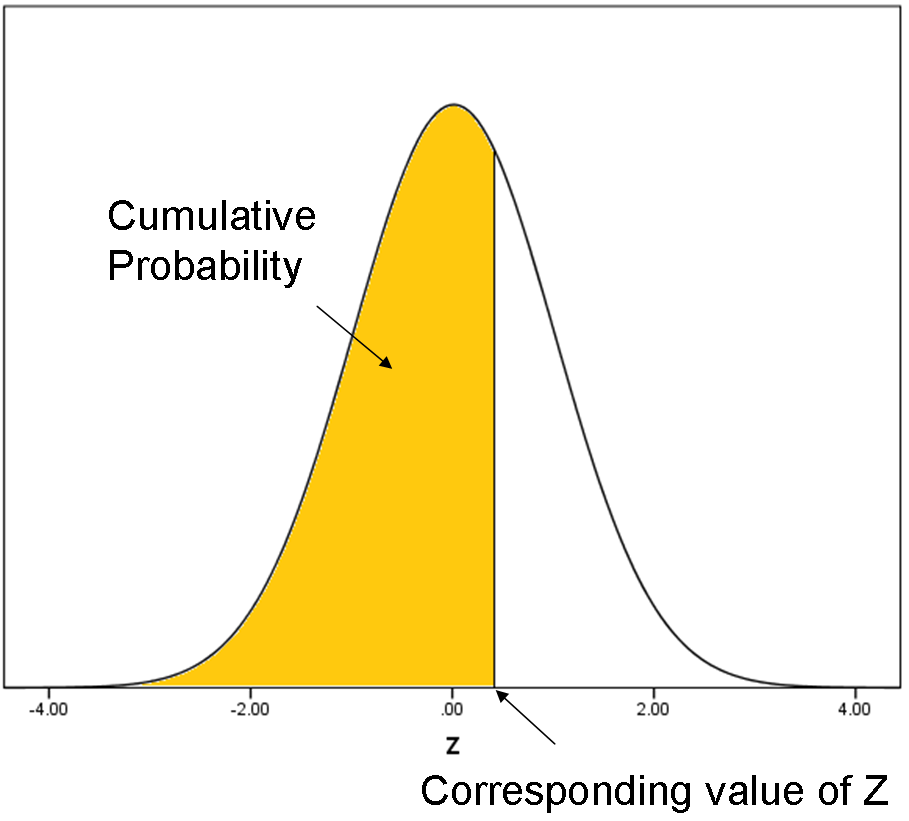
When we do the inverse normal transformation, we’re going in the opposite direction: for any cumulative probability, what is the corresponding Z value?
(See how there is a direct conversion from a probability to a number line that runs from -∞ to ∞)?
So you can think of the probit function as the Z (standard normal) value that corresponds to a specific cumulative probability.
Coefficients for probit models can be interpreted as the difference in Z score associated with each one-unit difference in the predictor variable.
Not very intuitive.
Another way to interpret these coefficients is to use the model to calculate predicted probabilities at different values of X.
Remember, though, just like in logistic regression, the difference in the probability isn’t equal for each 1-unit change in the predictor. The sigmoidal relationship between a predictor and probability is nearly identical in probit and logistic regression. A 1-unit difference in X will have a bigger impact on probability in the middle than near 0 or 1.
That said, if you do enough of these, you can certainly get used the idea. Then you will start to have a better idea of the size of each Z-score difference.
Communication:
In some fields, the convention is to use a probit model. Even if you get the same results from a logistic model, it’s worth sticking to the one your audience is familiar with if you’re in one of those fields. After all, why confuse your audience when the results are the same?
Go to the next article or see the full series on Easy-to-Confuse Statistical Concepts

I never realized that the probit function is the Z-value that corresponds to a specific cumulative probability. When I took my PhD qualifying exam (some years ago now), one of my professors gave me a question about using the probit function. It threw me off quite a bit, but I deduced that it was the same as the logit function (more or less). Anyway I passed with flying colors!
I run both logit and probit models using the same dataset, for the same variable I found opposite coefficient signs. Is that related to the different link functions they use?
So is the difference between a probit regression model and a logistic regression model the types of the observed outcome variable that each model can take?
Hi Frank,
No. Same outcome variable. The difference is entirely theoretical. It’s the link function you choose.
Thank you for such an intuitive explanation of the distinction between the two functions. I am a relatively newbie to statistical analysis of discrete data and had been wondering about the differences and similarities between the logit and the probit functions, and when to use which.
Dear Karen, reading the article, I have had a doubt. In case of cumulative percentage values (dependent variable) plotted against the time (independent variable), and this relation follows a logistic distribution, could the percentages be turned into probit values, for subsequent calculations, even if the distribution is, as written, logistic and not normal? I mean, can a logistic distribution be assimilate to a normal sigmoid distribution, without substantially affecting the results? Thank you.
Thank you for the clear explanation!
I have a question related to Propensity score analysis, are you familiar with this?
Thank you!
Thank so much for making it simple and straight forward, please i will need more note on binary probit distribution model
Thanks for this. So does it mean that you cannot get odds ratios when you are starting with probit regressions?
Correct.
For values of p between 0.01 and 0.99 (or even beyond those limits, depending on how finicky you want to be),
the straight line relationship logit(p) = 1.77 probit(p) can be used to translate to a logit scale, and hence to an odds ratio,
i like to use these models in my research
Thanks so much.Please I need a worked examples for better clarification.Better a real life situation.Thanks.
I am curious why the claim that the probit and logit are basically indistinguishable is true. Both functions do yield sigmoid curves that pass through (0.5,0) but the deviation between the functions becomes non-trivial as p goes to either 0 and 1. And even for values near 0.5, the absolute relative difference in the functions (abs{[logit(p)-probit(p)]/probit(p)}) is about 50%.
Is the proof of this statement from an analysis of the sampling distributions for the estimators using these two models?
Thanks!
logit(p), for p between 0.01 and 0.99, is close to 1.77 probit(p)
For most practical purposes, they differ only by a scale factor.
With p=0.5, both equal 0. You should get something like NaN for (0-0)/0.
“So we need a function of the probability that does two things: (1) converts a probability into a value that runs from -∞ to ∞ and (2) has a linear relationship with the Xs. Probit and Logistic functions both do that.”
Did you meant “non-linear relationship”? Weren’t you talking about why to use logit and probit instead of linear function?
I might have misunderstood though! Thanks!
Nope. Linear.
While P has a non-linear relationship with the Xs, once you apply the link function, the relationship becomes linear.
So logit(P) or probit(P) both have linear relationships with the Xs. P doesn’t.
That’s why you get coefficients on the scale of the link function that could be interpreted just like linear regression coefficients: for each 1-unit difference in X leads to a b unit difference in the log-odds of P.
But that’s not intuitive, so we back-transform to get an odds-ratio, which is no longer linear since we’ve taken it off the log scale.
Thanks for sharing this valuable information with such clarity and simplicity.
Regards. Upendra