Most statistical software packages use a spreadsheet format for viewing the data. This helps you get a feeling for what you will be working with, especially if the data set is small.
But what if your data set contains numerous variables and hundreds or thousands of observations? There is no way you can get warm and fuzzy by browsing through a large data set.
To help you get a good feel for your data you will need to use your software’s command or syntax editor to write a series of code for reviewing your data. Sounds complicated.
In Stata you will write and then save these commands in the “Do-file Editor”. Using the Do-file editor is as easy as using a word processor. You simply type in the commands you want to run.
You could also type the commands in a word processor and then copy and paste them in the Do-file editor. The keyboard commands are the same for copying and pasting, Ctrl-C and Ctrl-V.
A saved document created in the Do-file editor is known as a “do-file”. It’s known as a do-file because it will tell Stata what commands you want to run (how clever).
Because the do-file editor works just like a word processor you can copy from one do-file and paste into another do-file. So why re-invent the wheel every time you look at a new set of data?
To improve my efficiency I have created a template with the commands I need to review my data. I gave this do-file the very sophisticated name “variable review template”.
When looking at a data set for the first time I create a do-file and give it the name of the data set I am going to analyze, such as “wages”. The next step is to copy the commands from my “variable review template” and paste this into my new do-file “wages”.
The following are some of the commands that I have in my template.
The first command I use is “codebook, compact”.
A partial snapshot of the results are (click image to see it full size):
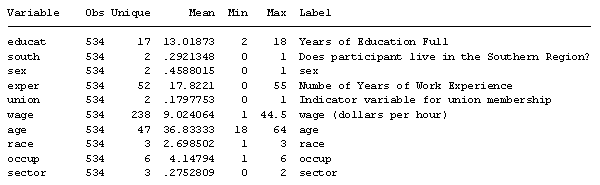
The first six columns will always have information. The label column will only have information if the programmer took the time to document the data. This can be very helpful information.
The next thing I like to know about my data is if any of the variables are string variables. If any are, I will most likely need to change them to numeric. The command I run for this is:
ds, has(type string)
If there are any string variables they will be listed in the “results” window. If there are any string variables I find it helpful to take a quick glance at them by using the following command plus the variable names:
Browse <plus variable names>
Next I want to know how many of the variables and the number of observations that have missing data. I use the following command:
mvpatterns, which gives me the following:
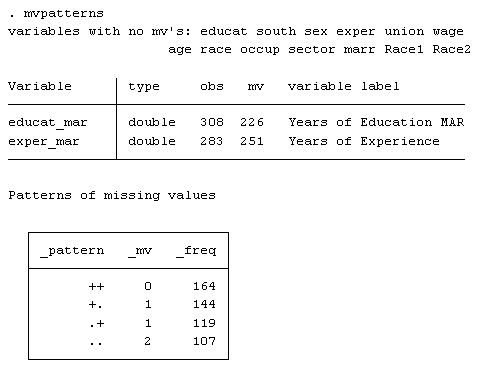
I see from the output that two variables are missing data, educat_mar and exper_mar. The “Patterns of missing values” box shows that only 164 out of the total 534 observations have no missing data.
Why is this important? Stata (as well as most other statistical packages) won’t use observations that are missing data when running a regression analysis.
Next, I like to determine whether my variables are categorical, continuous or dummy. In Stata there is no specific command that will give me this information. But the command “distinct” gives me most of the information I need. A partial print out for the wage data shows:
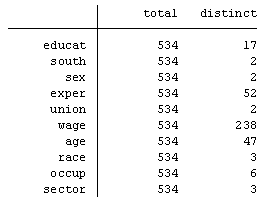
I can see that the variables south, sex and union have only 2 distinct values. I know that a dummy variable should be coded as “0” for no and “1” for yes.
A categorical variable could have as few as 2 distinct values as well, such as “1” for Democrat and “2” for Republican.
So I return to the output from the command “codebook, compact” and look at the columns “minimum” and “maximum”. I see that the variable south, sex and union are most likely binary variables and the variables race, occup and sector are categorical.
Note that a variable with a minimum of 0 and a maximum of 1 isn’t necessarily a dummy or a categorical variable. The variable could be the calculated proportion of some other variable and could have many distinct values between 0 and 1. The number of distinct values gives you a clue.
I note this information about the variables in my wage do-file. Stata recognizes a line starting with ”*” or “//” as text and not a command. So I add the following to my do-file:
// string variables: none
// categorical variables: race occup sector
// dummy variables: south sex union
// continuous variables: educat exper wage age
I now run box plots to look for outliers within my continuous variables. Outliers have the potential of having a significant impact on the statistical results. The analyst must be aware of this.
To do this I run box plots of each continuous variable. Below I use macros and loops. Whenever you are doing a one variable analysis on several variables it is always quickest to use macros and loops. I will show the coding but will explain how to do this in a future article.
local continuous educat exper wage age
foreach var in `continuous'{
graph box `var’, saving(`var’,replace)
}
local continuous educat.gph exper.gph wage.gph age.gph
graph combine `continuous’,rows(3) iscale(.5)
Generating frequency tables for categorical variables gives a good snapshot of the data. Running the codebook command will show what numerical values are assigned to each group.
The coding below uses a global macro (to be discussed in another article) and runs the frequency table and variable coding commands:
global categorical race occup sector
tab1 $categorical, sort
codebook $categorical
It is always a good idea to check the dummy variables to make sure they have been coded as 0 for no and 1 for yes. If they are the opposite it is best to recode them. The following coding runs frequency tables and variable coding commands as well:
global dummy south sex union
tab1 $dummy, sort
codebook $dummy
These are but a few of the commands that your variable review do-file should contain. They may look a bit confusing but it just takes a bit of practice to get the swing of it.
A “variable review” template is one of several templates that should be in your library of do-files. Combining templates with macros and loops will save you from countless hours of repetitive work. They will also reduce errors and oversights that can negatively impact your analysis.

Hi Jeff, I see you mention a template, but I don’t see where to download it. Where can I get it? Thanks 🙂
Hi Paula,
Many of the commands that I use are listed in the article. My suggestion is to copy those into your own do-file so that you can use those to view your data. I also suggest that you add commands over time to the do-file that you find helpful.
Jeff
Hi Jeff,
This is great, thank you. I am using them now but unfortunately, Stata says that commands ‘mvpatterns’ and ‘distinct’ are unrecognized. Could you help me why I receive this?
Thank you.
Hi Judit,
I see I failed to mention that both of these commands were written by non-Stata programmers. You will need to add them to your software. You can do that by typing in your command window “findit distinct”. When the results come up you can click on SJ-15-3 and then click on “install”. Do the same with “findit mvpattern” and click on dm91, then “install”. That will give you access to both commands.
Jeff
Thank you for this! I’ve already shared it with a colleague who has been using stata a little. I moved from SPSS to stata about a year ago, and have struggled with questions just like the ones answered in this article – what are the quick codes that stata provides for doing those early descriptive analyses of a data set. Thank you again for bringing such a gifted stata user onto your team!