Most of the p-values we calculate are based on an assumption that our test statistic meets some distribution. These distributions are generally a good way to calculate p-values as long as assumptions are met.
But it’s not the only way to calculate a p-value.
Rather than come up with a theoretical probability based on a distribution, exact tests calculate a p-value empirically.
The simplest (and most common) exact test is a Fisher’s exact for a 2×2 table.
Remember calculating empirical probabilities from your intro stats course? All those red and white balls in urns? The calculation of empirical probability starts with the number of all the possible outcomes. For example, we can figure out the probability of rolling a value 10 or higher using a pair of dice by looking at how frequently a 10, 11, or 12 appears out of all possible dice rolls.
Players of craps and Settlers of Catan can easily tell you that there are 36 possible outcomes from a pair of dice:
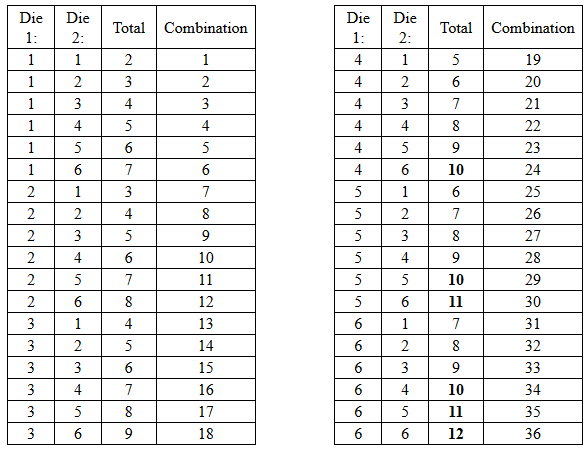
Of those 36 possible outcomes, there are 6 ways to roll a 10, 11, or 12 (bolded above). So the empirical probability of rolling a 10 or higher is 6/36 = .167.
Exact tests calculate the empirical probability of getting an outcome as different or more from the null hypothesis as the outcome you observed in your data. That is the exact p-value.
Let’s look at an example. The following 2×2 table displays a small sample (10 people). We’re interested in the relationship between poverty status and clinical depression status. Each cell represents a frequency count.
|
Clinically Depressed |
||||
|
In Poverty |
Yes |
No |
Total |
|
|
Yes |
2 |
2 |
4 |
|
|
No |
2 |
4 |
6 |
|
|
Total |
4 |
6 |
10 |
|
The Fisher’s Exact test, like the Chi-Square, tests the null hypothesis that Poverty and Depression are independent. If that’s true, then the proportion of people in and out of poverty should have the same proportion of depressed people. We see here the proportions are not the same—50% of those in poverty show clinical depression (2 out of 4), but only 33% of those not in poverty show clinical depression (2 out of 6).
If the proportions are different, that is evidence against the null hypothesis. The question is, are these proportions different enough to conclude that the variables are related?
Fisher’s exact calculates a p-value for this hypothesis in the following way: It counts all possible ways that 10 observations can fall into a 2×2 table with the same row and column totals as the observed table.
It then counts the number of tables that have proportions as or more different than the observed table. This is the exact p-value.
In this example, there are only five 2×2 tables that can have these particular row and column totals. So it’s a pretty simple calculation with small sample sizes.
But you can imagine that if the sample size got even moderately large (say 500), there would be a lot of back-end calculations, figuring out every possible table.
These calculations also get hairier as the size of the table gets bigger. So some software will only include exact tests for 2×2 tables, but that’s a software limitation, not a statistical one.
The best resource I’ve ever seen for exact tests (and there are many of them, not just Fisher) is the manual for StatXact software. It’s a standalone stat package for exact and non-parametric tests–and its manual is extremely helpful in describing not only the software, but the statistics for each test.

So is the Fisher’s Exact Test also a non-parametric test? My recollection is that Chi-squared tests are also non-parametric, hence my logic.
And I could be wrong!
Hi Jeff,
Yes. There is no parameter being estimated in a Fisher Exact.