How the Population Distribution Influences the Confidence Interval
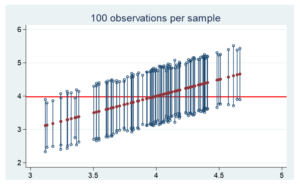
Spoiler alert, real data are seldom normally distributed. How does the population distribution influence the estimate of the population mean and its confidence interval? To figure this out, we randomly draw 100 observations 100 times from three distinct populations and plot the mean and corresponding 95% confidence interval of each sample. The three populations consist … Continue reading How the Population Distribution Influences the Confidence Interval
1 Comment