Spoiler alert, real data are seldom normally distributed. How does the population distribution influence the estimate of the population mean and its confidence interval?
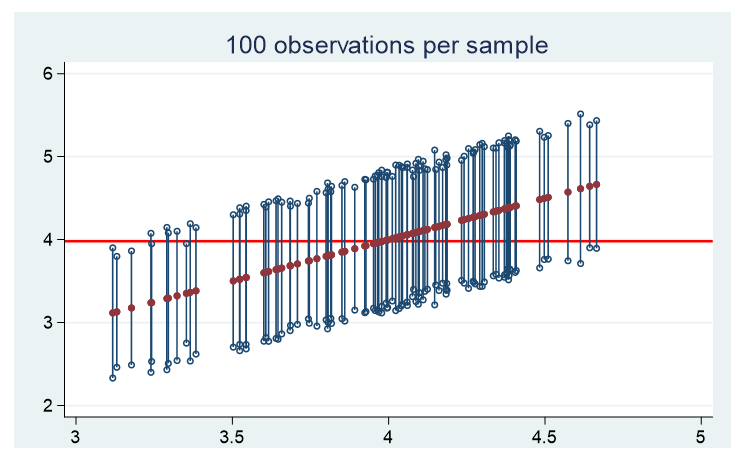
To figure this out, we randomly draw 100 observations 100 times from three distinct populations and plot the mean and corresponding 95% confidence interval of each sample.
The three populations consist of 10,000 observations with the following features.
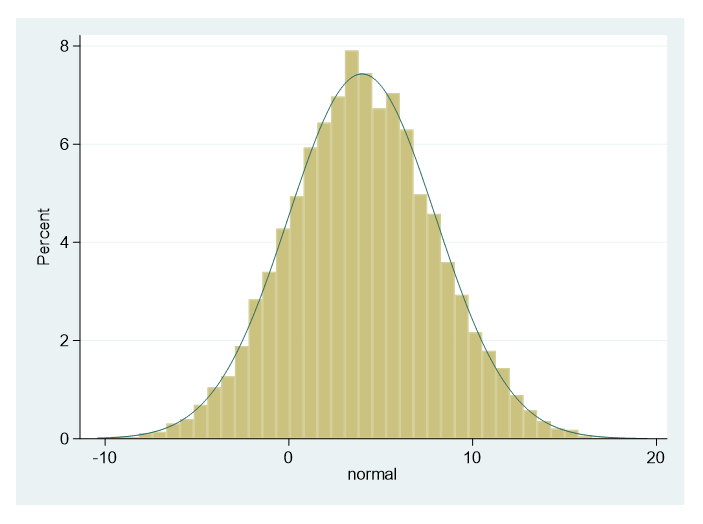
1. Normal distribution
with a mean of 4 and a standard deviation of 4:
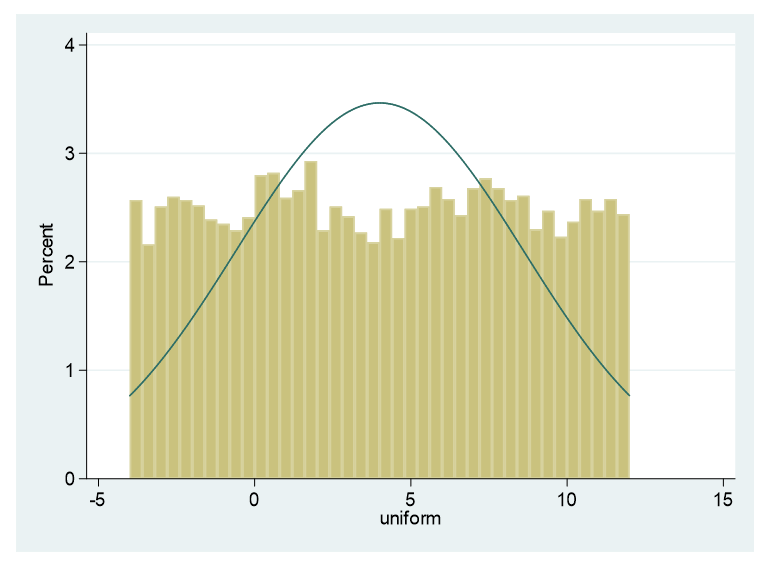
2. Uniform distribution
with a mean of 4 and a standard deviation of 4.60:
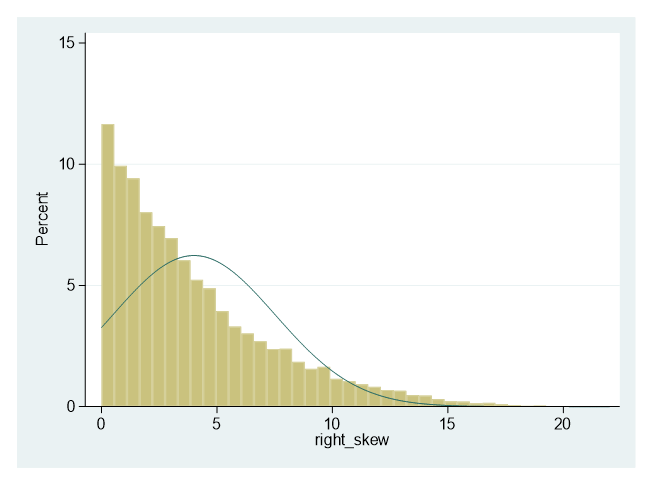
3. Right skewed
with a mean 4 and standard deviation of 3.5:
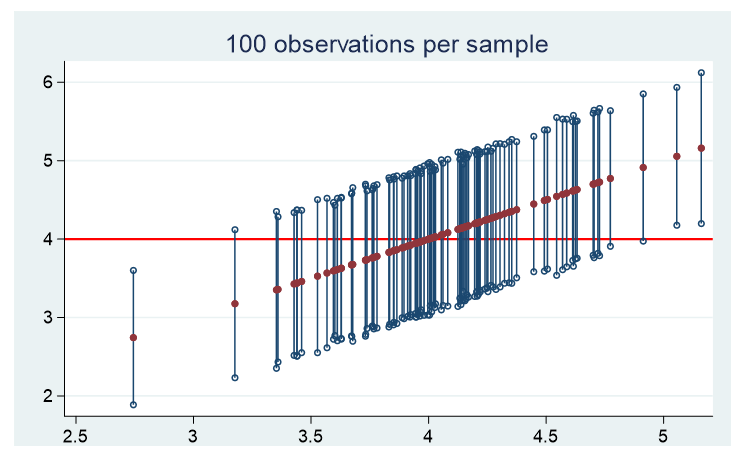
Here are the graphs of the means and confidence intervals for each of 100 samples for the three populations. Each of these confidence limits use a standard normal distribution to assess where 95% falls.
1. Normal distribution
2. Uniform distribution
3. Right Skewed
For all three distinct populations, there are approximately 5 samples whose confidence interval does not contain the population’s true mean.
The table below provides the mean of the 100 sample means, the mean width of the 100 confidence intervals, and the minimum and maximum widths. Note, my focus is on the width of the confidence intervals, not the actual values of the lower and upper confidence bounds.
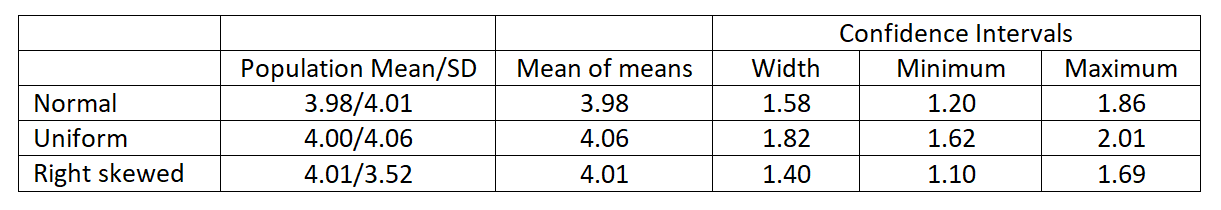
You’ll notice the mean of the sample means is very close to the population mean for all three distributions.
In addition, the key feature for determining the width of the confidence interval is the standard deviation of the population. The greater the population standard deviation, the wider the confidence intervals.
What about sample size?
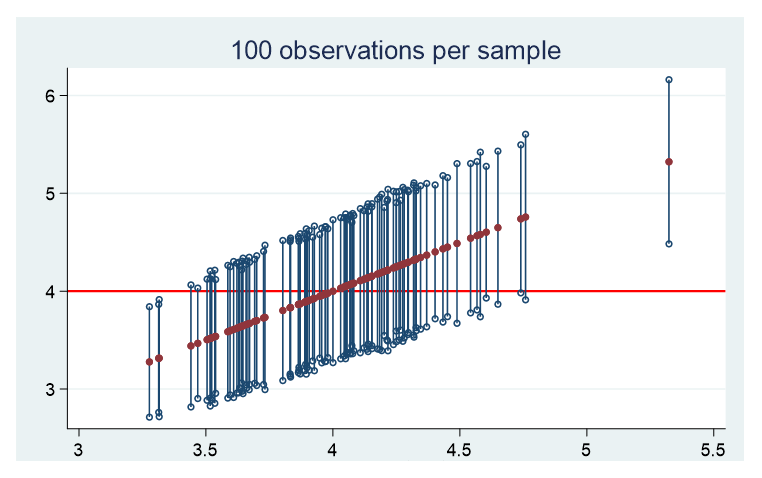
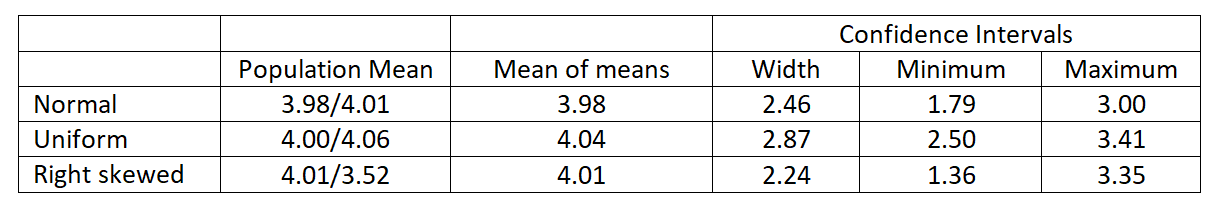
If we reduced our sample size to 40 observations, we have the following results. The mean of means is practically the same as the population mean. No difference there.
The noticeable difference between the 40 subjects versus 100 subjects all three confidence intervals widened substantially.
By using simulation, we have observed that:
1. The shape of the population distribution doesn’t affect how well the mean sample mean matches the population mean.
2. For all shapes, ~95% of the confidence intervals contained the true population mean.
3. The sample size had a bigger impact on the width of the confidence interval than did the shape of the population distribution.
The consistency of the sampling distribution is dependent on the sample size. Not on the distribution of the population. As the sample size decreases the absolute value of the skewness and kurtosis of the sampling distribution increases. This sample size relationship is expressed in the central limit theorem.
Jeff Meyer is a statistical consultant with The Analysis Factor, a stats mentor for Statistically Speaking membership, and a workshop instructor. Read more about Jeff here.
Thanks for a very interesting post ! I suspect more extensive simulations would show that lower sample sizes lead to increased failure of the confidence intervals to give 95% coverage, esp with high-skew populations – essentially as the Central Limit Theorem finds it harder to extract a nice, symmetric CI via sampling from such a population (as suggested by the Berry-Esseen Theorem)