Any time you report estimates of parameters in a statistical analysis, it’s important to include their confidence intervals.
How confident are you that you can explain what they mean? Even those of us who have a solid understand of confidence intervals get tripped up by the wording.
The Wording for Describing Confidence Intervals
Let’s look at an example.
The average person’s IQ is 100. A new miracle drug was tested on an experimental group. It was found to improve the average IQ 10 points, from 100 to 110. The 95 percent confidence interval of the experimental group’s mean was 105 to 115 points.
Which if any of the following are true:
1. If you conducted the same experiment 100 times, the mean for each sample would fall within the range of this confidence interval, 105 to 115, 95 times.
2. The lower confidence level for 5 of the samples would be less than 105.
3. If you conducted the experiment 100 times, 95 times the confidence interval would contain the population’s true mean.
4. 95% of the observations of the population fall within the 105 to 115 confidence interval.
5. There is a 95% probability that the 105 to 115 confidence interval contains the population’s true mean.
A Visual Description Really Helps
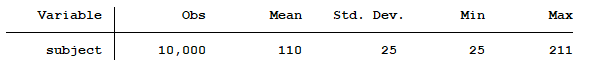
Not sure? To help you visualize what a confidence interval is, let’s generate a random population of 10,000 observations. The population’s mean is 110 with a standard deviation of 25.
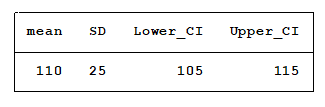
Next, we will randomly draw a sample of 100 observations from this population. Below, you see the mean, standard deviation and confidence interval of the sample’s mean.
So far, so good. In reality, we seldom draw more than one sample from a population when conducting a study. To help us visualize how confidence intervals change as the sample changes we will randomly draw 99 more samples. This lets us graph each sample’s mean and confidence interval.
The horizontal red line at 110 is the population mean. The red dots represent each sample’s mean.
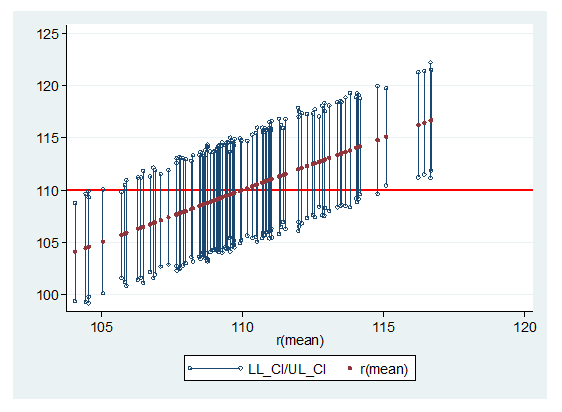
What can we observe from this graph?
1. The lower and upper confidence limits are seldom if ever the same.
2. Some confidence intervals have a narrower range than others.
Keep in mind that all samples came from the same population.
Comparing the Wording the the Visual
Let’s look now at the multiple choices to the quiz, starting with the first choice.
Does the mean of each sample fall within any one sample’s confidence interval 95 out of 100 times?
Well, that would depend upon which sample we chose. If we chose a sample whose mean is near 110 that might be true. But ff our sample was similar to one from either edge of the graph it would not be true. The problem is, we never know where our sample is in relation to other possible samples.
Response 1 is incorrect.
With regards to response 2, we can see that the lower confidence level is below 105 for a substantial number of samples.
So response 2 is incorrect.
How about response 4, 95% of the population falls within the confidence interval? Well, it was given that the population mean was 110 and the standard deviation was 25. As a result, 95% of the observation of the population are between 60 and 160.
Therefore, response 4 cannot be true.
Response 3 is correct. Approximately 95 out of 100 of the confidence intervals contain the population mean. The graph shows 91 out of 100 contain the true mean. If a different seed had been used to draw the samples, the results could have been more than 95 out of 100 confidence intervals containing the true mean. But on average, 95 out of 100 confidence intervals will contain the true mean.
Response #5 was shown to be correct when this blog post was originally posted. One of our readers felt that it was incorrect and included a link to this article: https://link.springer.com/article/10.3758/s13423-015-0947-8 . We appreciate our readers’ input.
A very important point to remember, expect a sample’s 95% confidence interval to not contain the population mean 5% of the time.
Jeff Meyer is a statistical consultant with The Analysis Factor, a stats mentor for Statistically Speaking membership, and a workshop instructor. Read more about Jeff here.
Would 1 be correct? From the 100 means (denoted by the red points), it is about 95 of them are within 105 to 115.
Whew! Those five answers are so close, you really have to carefully dissect them.
And this doesn’t even consider the issue of “prediction intervals” . . .
the in which it is tried to explain CI is good, but #5 is not clear.
Hi Martina, we have edited the blog. Thank you for your comments.
Jeff
The previous replies are right: response 5 is not correct as 110 is for sure in the interval [105,115]. As those replies are from 2019, I do not understand why it is still incorrect…
Hi Martina,
I have edited the blog to correct the error. Thanks to you and Daniel for commenting.
Jeff
I think response #5 is not correct, only #3 is correct. Response #5 relates to the “Fundamental Confidence Fallacy”, see fallacy 1 in this paper:
https://link.springer.com/article/10.3758/s13423-015-0947-8
One way to remember what CI do is to think of the as “compatible intervals” (see https://www.nature.com/articles/d41586-019-00857-9), i.e. “all the values between the interval’s limits are reasonably compatible with the data, given the statistical assumptions used to compute the interval”. And further, “because the interval gives the values most compatible with the data, given the assumptions, it doesn’t mean values outside it are incompatible; they are just less compatible”.
Daniel’s comment is correct, #5 is not correct (under the intuitive meaning of “95% probability”), and its meaning is not the same as #3.
However, the rest of the text is written well, and I especially like the plot of the 100 confidence intervals, which clearly shows the meaning of a confidence interval: about 5 (in this case, 9) out of 100 of the CIs do not contain the true mean. Meaning it either does or doesn’t, but for most samples it does. As an experiment results in a single sample, one cannot talk about probabilities here.