new blog post: Member Training: The Dark Side of Data Science

Previous Posts
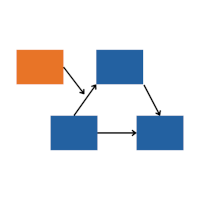
Mediation analysis is a model of the causal pathway between an independent variable, X, and a dependent variable, Y, through a mediating variable, M. In this training,
Regression models, such as linear, logistic, time to event, and mixed models, measure the strength of the association between the dependent variable and the independent variables.
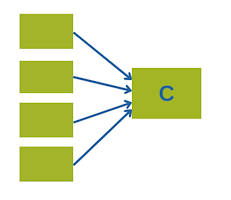
When you’re working with many correlated variables, they get too unwieldy to use individually.
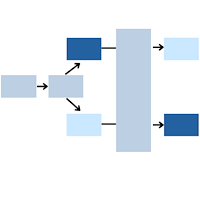
Cross-over trials provide a very powerful approach for comparing two treatment conditions. Research subjects get both treatment conditions, which we will label arbitrarily as A and B.

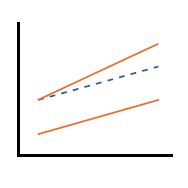
Estimated marginal means (EMMs)—sometimes called least-squares means—are a powerful way to interpret and visualize results from linear and mixed-effects models. Yet many researchers struggle to extract, understand, and plot them. Learn more in this 60-minute tutorial.
Outliers. There are as many opinions on what to do about them as there are causes for them. In this webinar, we’ll explore the different types of outliers, methods for figuring out which type you have, whether they’re influential, and what to do about them.

Repeated measures ANOVA doesn’t cut it for many repeated measures situations, but do you always need mixed models instead?
After talking with enough researchers, I've come to a few conclusions about why some researchers feel embarrassed about their statistical abilities, why they shouldn't, and what they need to become a proficient and confident statistical analyst.
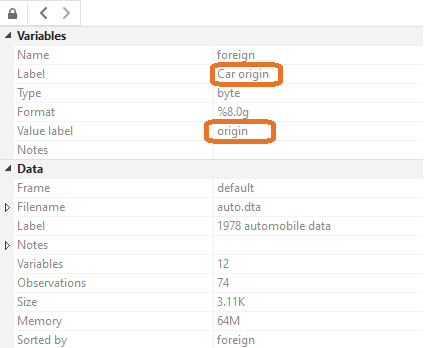
We’ll now teach you to make your variables more approachable by adding labels. Note the different sections for “Label” and “Value label”. A label just provides a description of the variable, while a value label matches numbers to words.
 stat skill-building compass