new blog post: Member Training: The Dark Side of Data Science

Previous Posts
You’ll be excited to hear we’re doing another Statistics Skills Accelerator for our Statistically Speaking members: Count Models. Stats Skills Accelerators are structured events focused on an important topic. They feature Stat’s Amore Trainings in a suggested order, as well as live Q&As specific to the Accelerator.
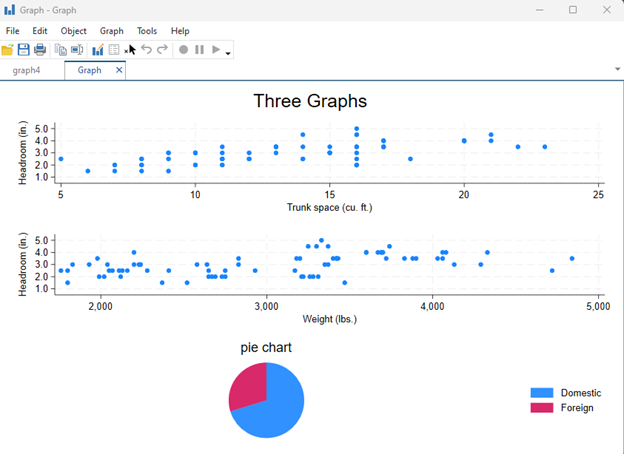
Once you’ve imported, examined, and cleaned your data, a common next step would be to make some visual displays or graphs. In this article we’ll go over the details of creating, naming, saving, and exporting graphs in Stata. We will do all of this using syntax, rather than Stata’s “Graphics” menu. If you want a […]
There are not a lot of statistical methods designed just for ordinal variables. But that doesn't mean that you're stuck with few options. There are more than you'd think...
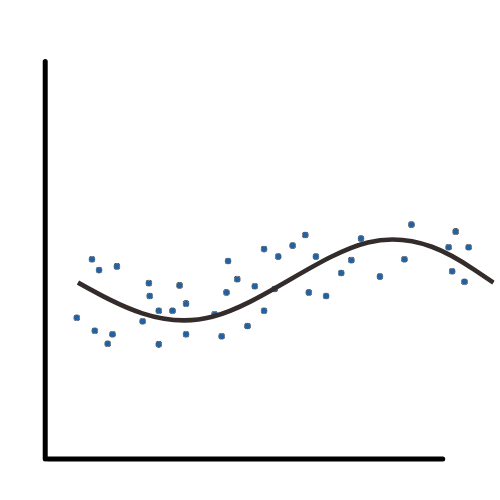
Splines provide a useful way to model relationships that are more complex than a simple linear function.
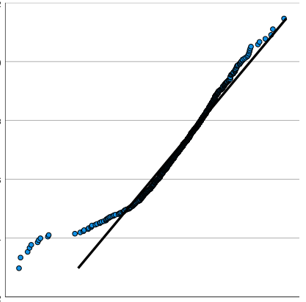
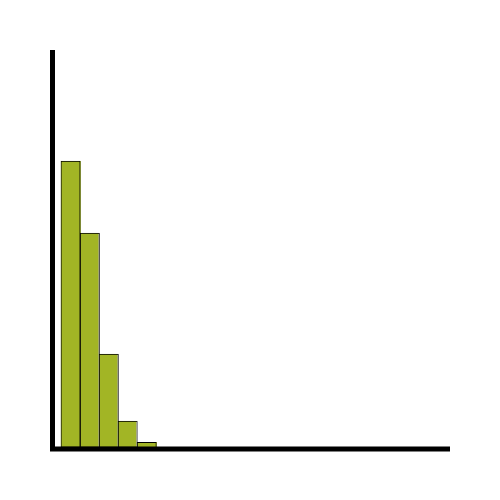
Across the bottom are the observed data values, sorted lowest to highest. You can see that just like on the histogram, the values range from about -2.2 to 2.2. (Note, these are standardized residuals, so they already have a mean of 0 and a standard deviation of 1. If they didn’t, the plot would standardize them before plotting).

This month we are featuring a 9-module software tutorial by Kim Love: An Introduction to Data Analysis using R. It’s perfect for people who: have never used R before, need to refresh their R skills after not using it for while, have figured out R on their own and would like a more systematic tutorial
From the last post in this series, you should know how to change between numeric types and easily change numeric data. We’ll now expand your type-changing skills to include changing string variables with two new commands.
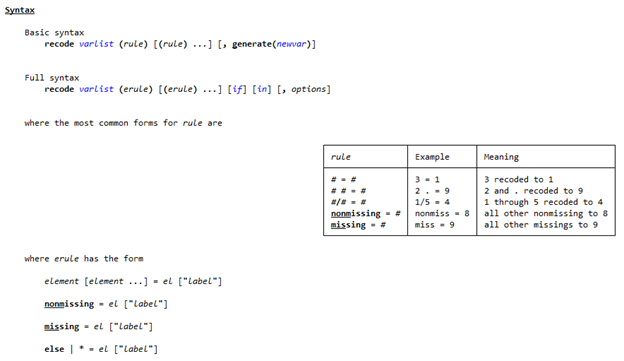
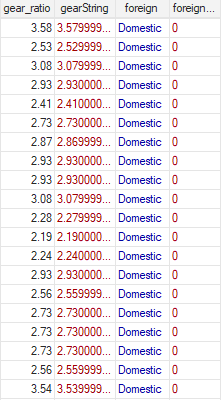
From our last posts in this series, you should be comfortable with how Stata handles data editing, as well as with making your own variables. In this post, we’ll talk about commands that edit the content or storage type of your variables in Stata: recode and recast. Let’s start off with the recode command.
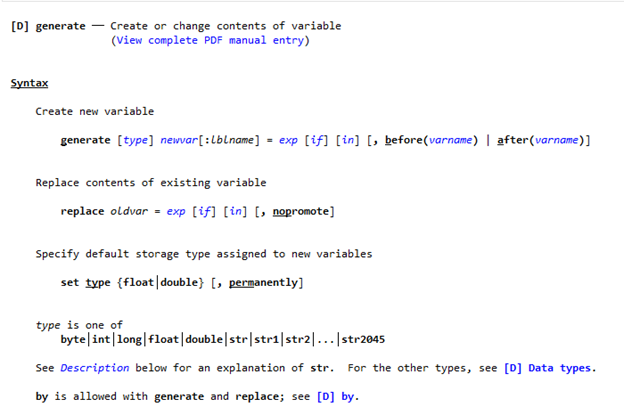
From our last article, you should feel comfortable with the idea of editing and saving data sets in Stata. In this article, we’ll explain how to create new variables in Stata using replace, generate, egen, and clonevar.
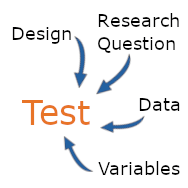
Even experienced data analysts can get off track, especially with large data sets with many variables. It's just so easy to try different versions of models or get distracted by interesting, but irrelevant, relationships among variables. The lesson? Make a plan.
 stat skill-building compass