new blog post: Member Training: The Dark Side of Data Science

Previous Posts
Item Response Theory (IRT) refers to a family of statistical models for evaluating the design and scoring of psychometric tests, assessments and surveys. It is used on assessments in psychology, psychometrics, education, health studies, marketing, economics and social sciences — assessments that involve categorical items (e.g., Likert items).
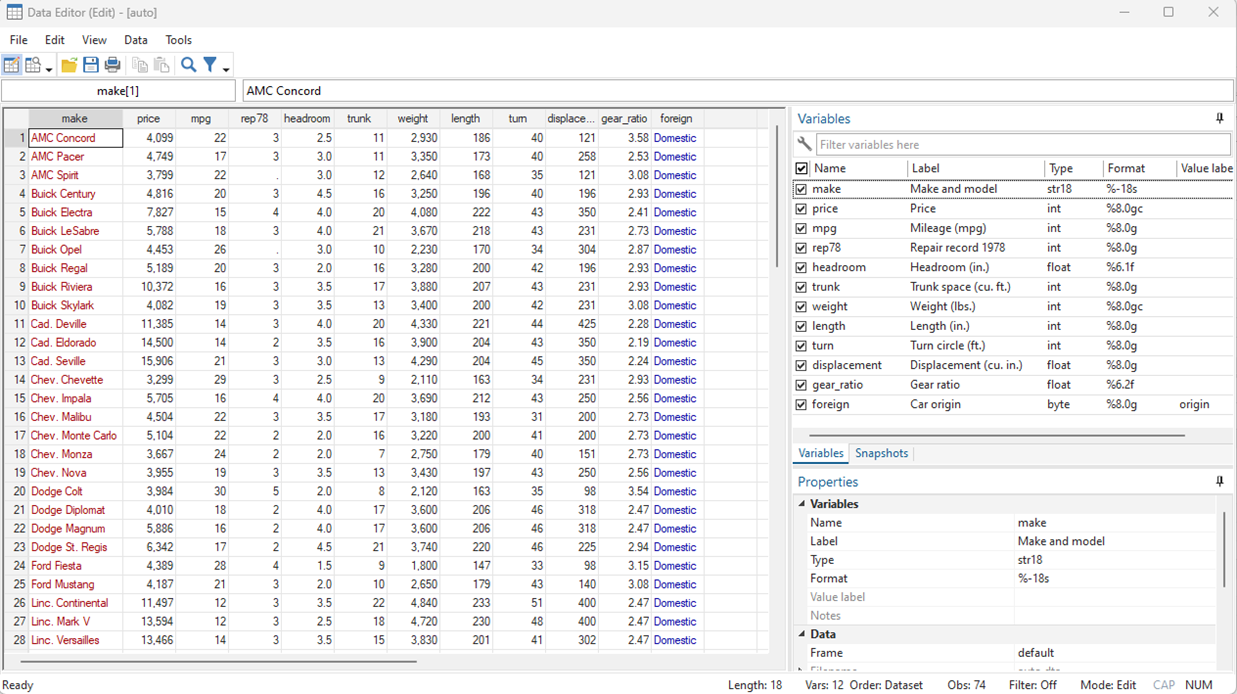
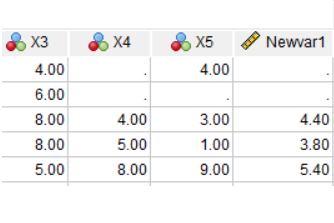
Stata makes it a breeze to edit or clean your data. If you’re unfamiliar with using data sets in Stata, check out these blog posts to get a good grasp on importing and browsing data in Stata. For this tutorial we will be using Stata’s “auto” data set. If you haven’t loaded it in yet, […]
Item Response Theory (IRT) refers to a family of statistical models for evaluating the design and scoring of psychometric tests, assessments and surveys. It is used on assessments in psychology, psychometrics, education, health studies, marketing, economics and social sciences — assessments that involve categorical items (e.g., Likert items).
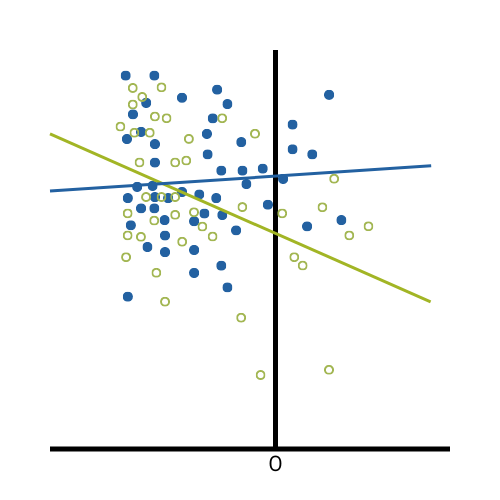
Sometimes it's because the dependent variable just isn't appropriate for a GLM. The dependent variable, Y, doesn't have to be normal for the residuals to be normal (since Y is affected by the X's). But Y does have to be continuous, unbounded, and measured on an interval or ratio scale.

There’s a common saying among pediatricians: children are not little adults. You can’t take a drug therapy that works in adults and scale it down to a kid-sized treatment. Children are actively growing. Their livers metabolize drugs differently, and they have a stage of life called puberty that many of us have long forgotten. Likewise, […]
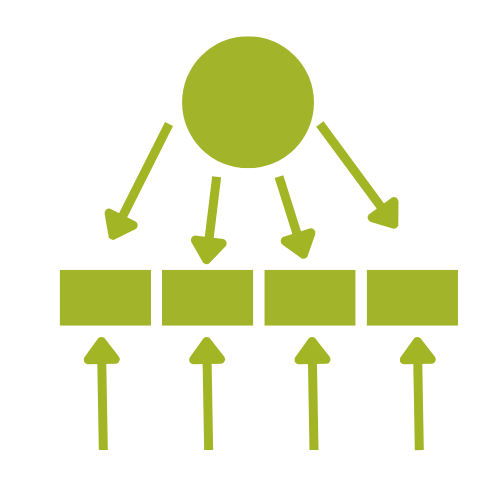
Many variables we want to measure just can’t be directly measured with a single variable. Instead you have to combine a set of variables into a single index. But how do you determine which variables to combine and how best to combine them? Exploratory Factor Analysis.
Level is a statistical term that is confusing because it has multiple meanings in different contexts (much like alpha and beta). There are three different uses of the term Level in statistics that mean completely different things. What makes this especially confusing is that all three of them can be used in the exact same […]
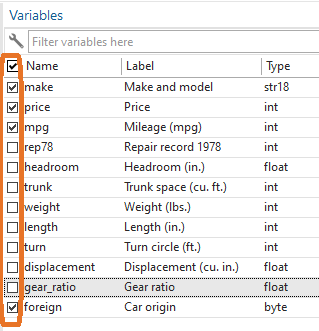
Once you’ve imported your data into Stata the next step is usually examining it. Before you work on building a model or running any tests, you need to understand your data. Ask yourself these questions: Is every variable marked as the appropriate type? Are missing observations coded consistently and marked as missing? Do I want […]
SPSS has a nice little feature for adding and averaging variables with missing data that many people don’t know about. It allows you to add or average variables that have some missing data, while specifying how many are allowed to be missing.
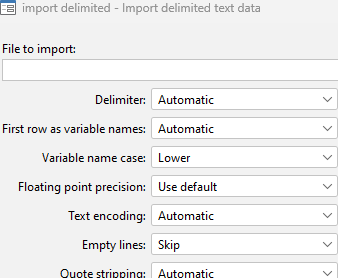
In our previous posts, we’ve relied on Stata’s pre-loaded datasets to perform analyses. But when you’re working with your own data, you’ll need to know how to import it into Stata. To demonstrate how this process works, we will use the Iris dataset from UCI. Download the dataset, then move it to whichever directory you […]
 stat skill-building compass