There are many designs that could be considered Repeated Measures design, and they all have one key feature: you measure the outcome variable for each subject on several occasions, treatments, or locations.
Understanding this design is important for avoiding analysis mistakes. For example, you can’t treat multiple observations on the same subject as independent observations.
Example
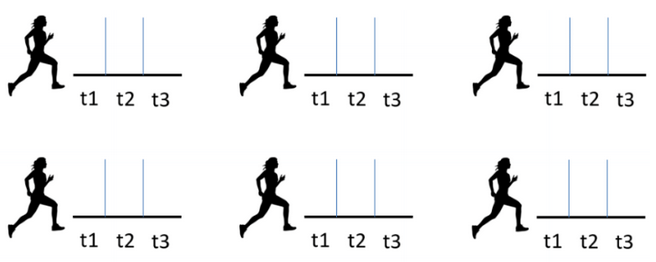
Suppose that you recruit 10 subjects for an athletic training experiment. Each subject runs a mile on three separate occasions, and your outcome of interest is run time. So you have 30 measures of the outcome variable in your data set.
Ignoring the fact that three run time measures come from each subject would treat the data as coming from 30 different subjects! This artificially inflates sample size and artificially minimizes standard errors for treatment effects. In turn, this would deflate p values.
How to Design a Repeated Measures Study
Let’s look at one version of a repeated measures study—one in which we want to compare two treatment groups over time. To measure the effects of a treatment over time, start by assigning the subjects randomly to treatment or control groups. You do this the same as if you were measuring outcomes only one time each.
Also, you might want to measure things about the subjects that could affect the outcome. These would be included as covariates in the statistical analysis. It is important to keep in mind that some of these covariates may stay the same and some may change over time.
The ones that stay the same are measured once per subject. The ones that change are measured at multiple occasions for the same subject.
After assigning runners to different training regimens, decide if you should account for other variables that might impact mile run time. For example, gender and age might affect the time to run a mile. Humidity might also affect the time to run a mile.
Note that the first two variables are associated with the runner and will stay the same over the course of training. Humidity will change from one occasion to the next.
After the experiment, your data set will include multiple observations from each subject. Each observation will include the following information:
- A way to identify the runner within the data
- The time point of the observation
- Variables measured once per subject like gender and age
- Variables measured on each occasion per subject like humidity
- The outcome variable, run time, which is measured on each occasion per subject.
How to Analyze Repeated Measures Data
A common choice for analyzing repeated measures designs is the repeated measures analysis of variance (ANOVA). This works well in limited situations. For example, if there are occasion specific variables (like humidity) and the only thing that varies from one time to the next is the outcome of interest, ANOVA might be okay. However, the ANOVA model has very specific assumptions that are often not met in real data.
An option that works better in a lot more situations is the marginal model. With marginal models, you can specify the type of correlation that exists among outcome measurements from the same subject. For example, this model can adjust for some runners being generally faster than others.
It can also adjust if times for runs that take place closer together are more similar than for runs that are further apart. Occasion-specific variables, like humidity, are also easily accounted for.
In the marginal model, time can be treated as numeric or categorical. ANOVA can only treat time as categorical. A final advantage of this approach is that it can accommodate missing time points for a single subject- something ANOVA cannot do.
Final Comments
When planning your repeated measures study, consider the limits of ANOVA and the flexibility of marginal models. In many instances, marginal models will be the better choice for your analysis. Although learning this approach will take some extra time, it is worth adding this skill to your toolkit if you are doing repeated measures studies.

Leave a Reply