No matter what statistical model you’re running, you need to take the same steps. The order and the specifics of 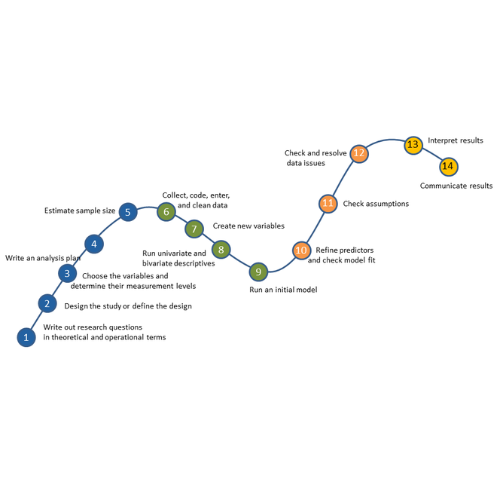 how you do each step will differ depending on the data and the type of model you use.
These steps are in 4 phases. Most people think of only the third as modeling. But the phases before this one are fundamental to making the modeling go well. It will be much, much easier, more accurate, and more efficient if you don’t skip them.
And there is no point in running the model if you skip the last phase. That’s where you communicate the results.
I’ve found that if I think of them all as part of the analysis, the modeling process is faster, easier, and makes more sense.
Phase 1: Define and Design
In the first five steps of running the model, the object is clarity. You want to make everything as clear as possible to yourself. The clearer things are at this point, the smoother everything will be.
1. Write out research questions in theoretical and operational terms
A lot of times, when researchers are confused about the right statistical method to use, the real problem is they haven’t defined their research questions. They have a general idea of the relationship they want to test, but it’s a bit vague. You need to be very specific.
For each research question, write it down in both theoretical and operational terms.
2. Design the study or define the design
Depending on whether you are collecting your own data or doing secondary data analysis, you need a clear idea of the  design. Design issues are about randomization and sampling and variables. Some examples:
• Nested and Crossed Factors
• Potential confounders and control variables
• Longitudinal or repeated measurements on a study unit
• Sampling: simple random sample or stratification or clustering
3. Choose the variables for answering research questions and determine their level of measurement
Every model has to take into account both the design and the level of measurement of the variables.
Level of measurement, remember, is whether a variable is nominal, ordinal, or numerical. But there’s nuance here for choosing an analysis. For example, you also need to know if variables are discrete counts, continuous, proportions, time to event, etc.
It’s absolutely vital that you know the level of measurement of each response and predictor variable, because they determine both the type of information you can get from your model and the family of models that is appropriate.
4. Write an analysis plan
Write your best guess for the statistical method that will answer the research question, taking into account the design and the type of data.
It does not have to be final at this point—it just needs to be a reasonable approximation.
5. Calculate sample size estimates
 This is the point at which you should calculate your sample sizes—before you collect data and after you have an analysis plan. You need to know which statistical tests you will use as a basis for the estimates.
And there really is no point in running post-hoc power analyses—it doesn’t tell you anything.
Phase 2: Prepare and explore
In this phase, the focus is on getting the data into a format so you can analyze it and understanding what you’re working with. While you may not thing of these steps as running the statistical model, they’re important preparation.
What happens here could affect the plan you devised in step 4 or give you clarity in steps 10-12 when something seems strange.
6. Collect, code, enter, and clean data
The parts that are most directly applicable to modeling are entering data and creating new variables.
For data entry, the analysis plan you wrote will determine how to set up the data set. For example, if you will be doing a linear mixed model, you will want the data in long format.
7. Create new variables
This step may take longer than you think; it can be quite time consuming. It’s pretty rare for every variable you need for analysis to be collected in exactly the right form.
Create indices, categorize, reverse code, whatever you need to do to get variables in their final form, including running principal components or factor analysis.
8. Run Univariate and Bivariate Descriptives
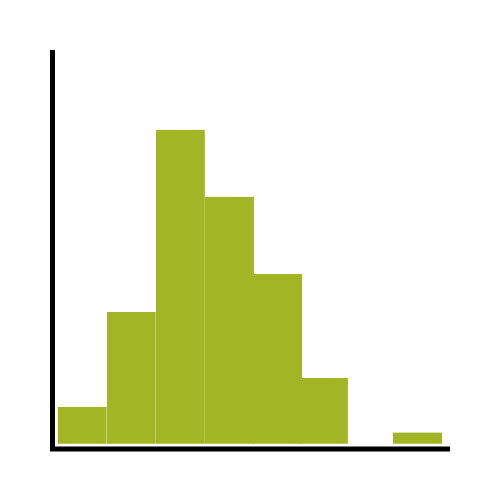 You need to know what you’re working with. Check the distributions of the variables you intend to use, as well as bivariate relationships among all variables that might go into the model.
You may find something here that leads you back to step 7 or even step 4. You might have to do some data manipulation or deal with missing data.
More commonly, it will alert you to issues that will become clear in later steps. The earlier you are aware of issues, the better you can deal with them. But even if you don’t discover the issue until later, it won’t throw you for a loop if you have a good understanding of your variables.
9. Run an initial model
Once you know what you’re working with, run the model listed in your analysis plan. In all likelihood, 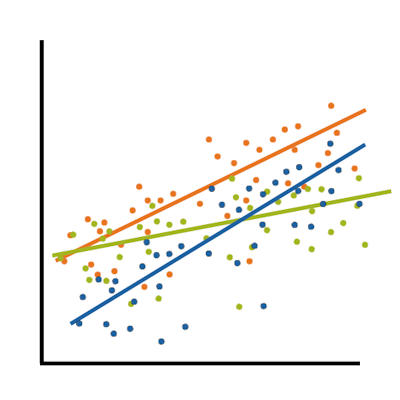 this will not be the final model.
But it should be in the right family of models for the types of variables, the design, and to answer the research questions. You need to have this model to have something to explore and refine.
Phase 3: Refine the model
Now we get into the nitty gritty steps of running the statistical model. The initial model you ran in step 9 is almost never the one you’ll end with.
10. Refine predictors and check model fit
If you are doing a truly exploratory analysis, or if the point of the model is pure prediction, you can use some sort of stepwise approach to determine the best predictors.
If the analysis is to test hypotheses or answer theoretical research questions, this part will be more about refinement. You can
• Test, and possibly drop, interactions and quadratic or explore other types of non-linearity
• Drop nonsignificant control variables
• Do hierarchical modeling to see the effects of predictors added alone or in blocks.
• Test the best specification of random effects
11. Check assumptions
 Because you already investigated the right family of models in Part 1, thoroughly investigated your variables in Step 8, and correctly specified your model in Step 10, you should not have big surprises here.
Rather, this step will be about confirming, checking, and refining. But what you learn here can send you back to any of those steps for further refinement.
That said, it’s a very important step. Don’t skip it.
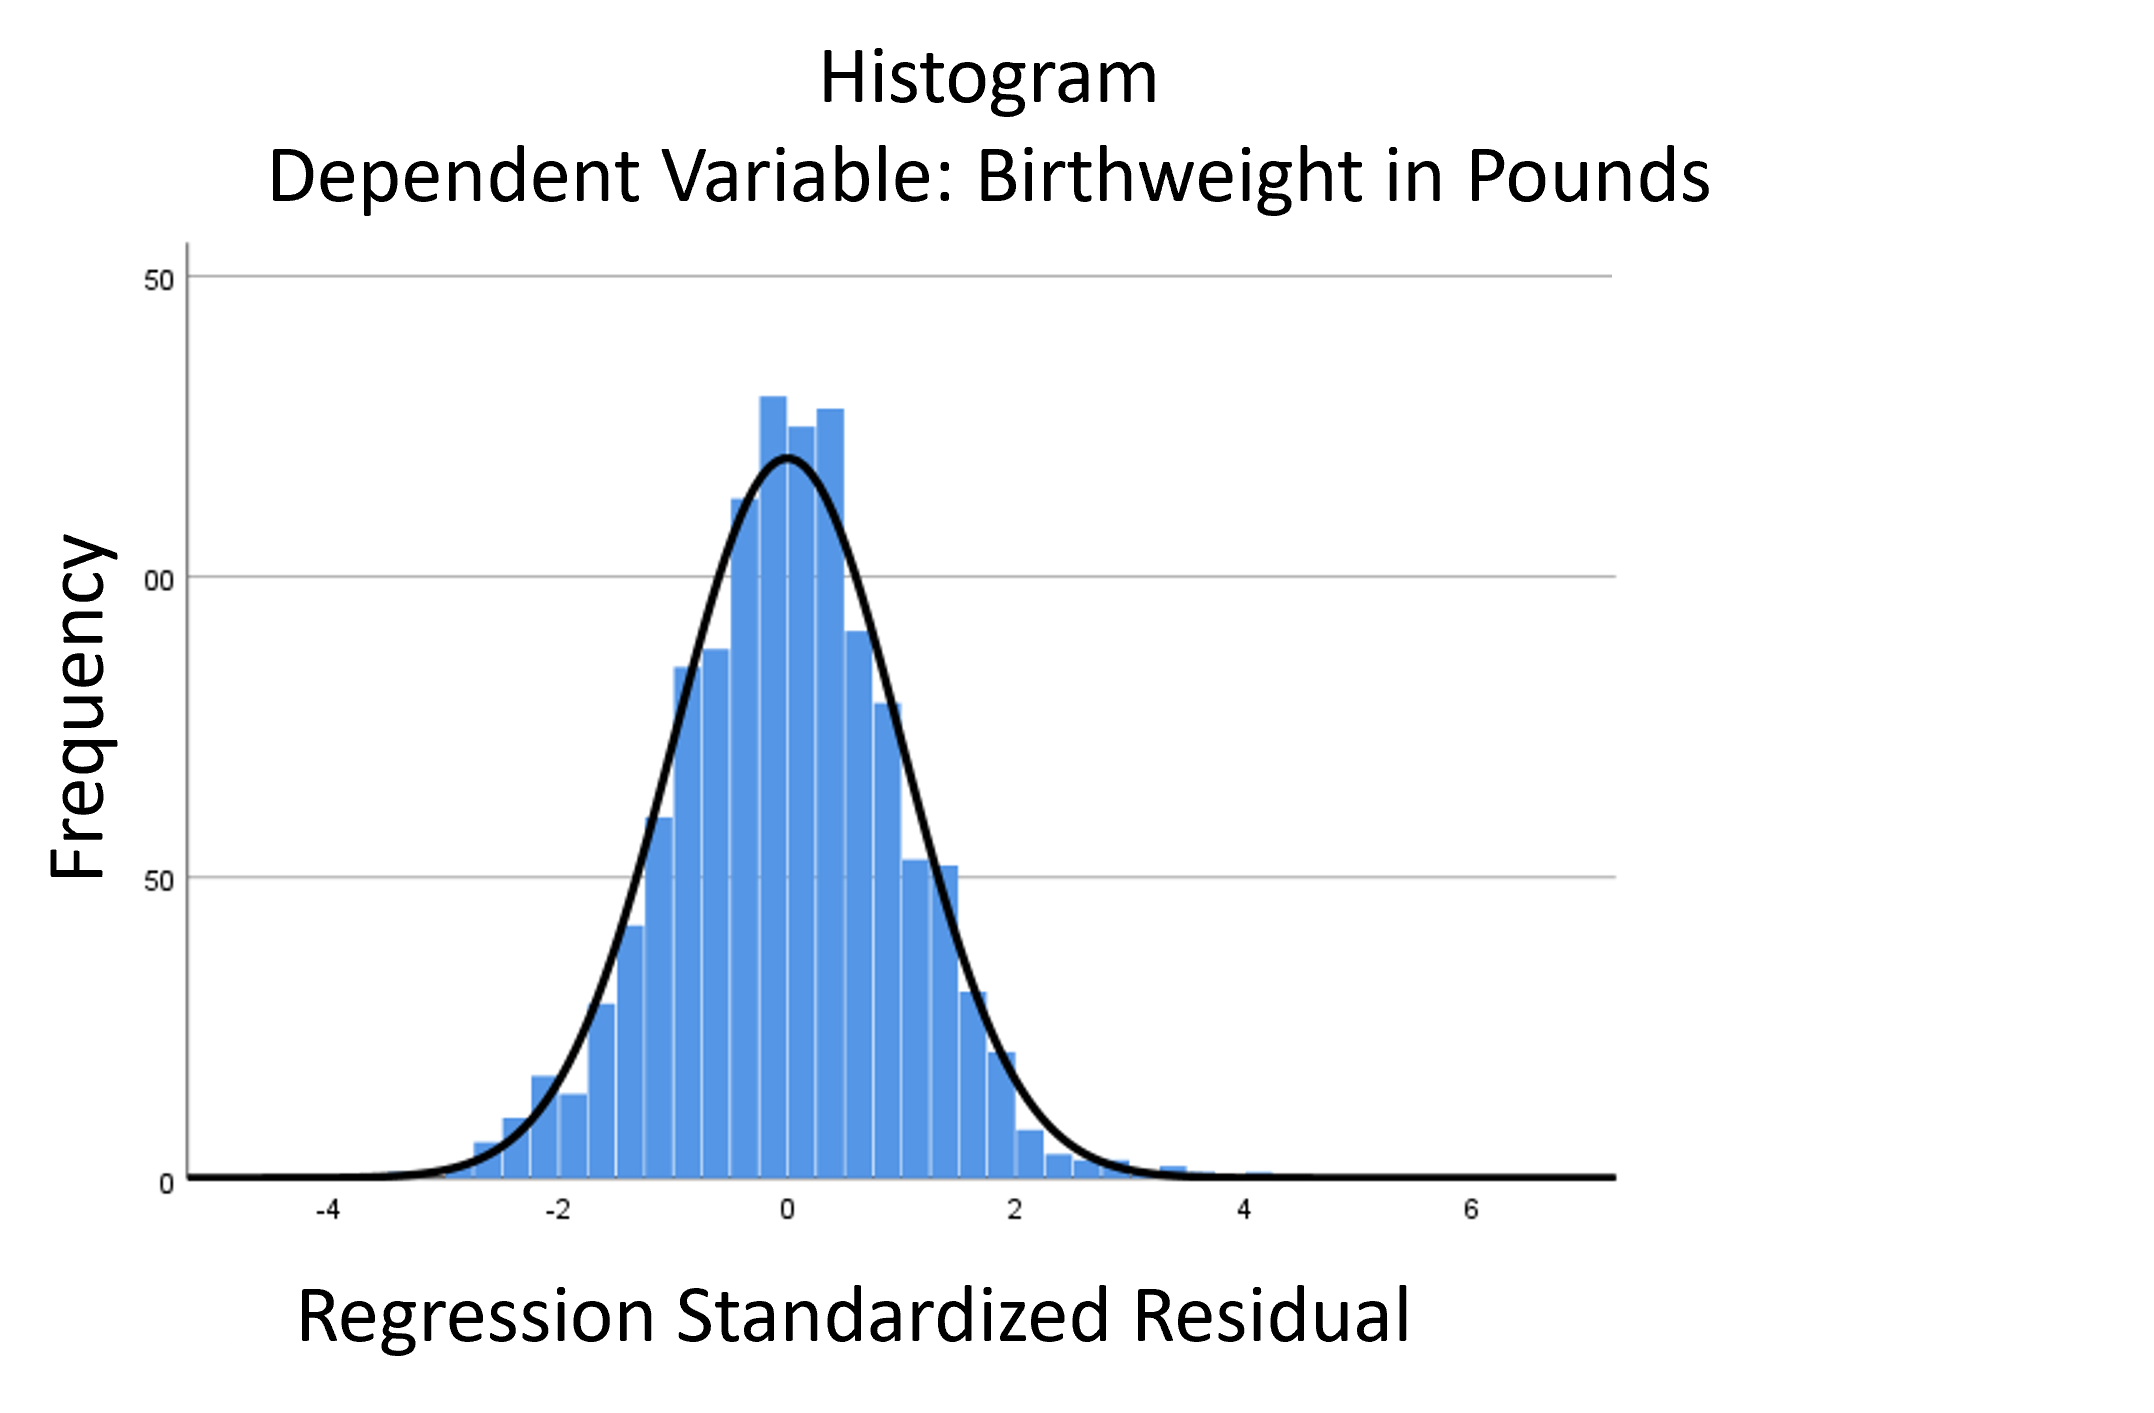
Because many of the assumptions are about the errors, much of this step involves analyzing the residuals. So you really can’t do it (or much of the next one) until you’ve run your final model.
12. Check for and resolve data issues
Steps 11 and 12 are often done together, or perhaps back and forth. Both involve residual analysis.
This is where you check for data issues that can affect the model, but are not exactly assumptions.
Data issues are about the data, not the model, but occur within the context of the model. These include:
- Small Samples
- Multicollinearity
- Outliers and influential points
- Missing data
- Truncation and censoring
Once again, data issues don’t appear until you have chosen variables and put them in the model.
Phase 4: Answer the Research Question
While you may thing that running the statistical model is over, the next few steps are hugely important. They might send you back to previous steps when something seems strange. Or they might just give you exactly what you set out for–an answer to your research question.
13. Interpret Results
Now, finally, interpret the results.
You may not notice data issues or misspecified predictors until you interpret the coefficients. Then you find something like a super high standard error or a coefficient with a sign opposite what you expected, sending you back to previous steps.
And now that you understand what you found, you can share it.
14. Write up Results
 This might the hardest and most important step of all.
It includes creating graphs and tables that are ready for your reader (not just the ones you’ve created early on to help you understand what’s going on in the data).
It also includes the write-up of results, whether that’s for a journal article, thesis, or report for management. Or a conference paper or poster.
This step can take weeks, even if there is nothing that comes up during your write up that makes you go back and refine something earlier in the analysis—for example, realizing that you need more descriptive stats to complete a table.

I thank you very much for the detailed steps. But the problem is how to practically know each steps in different types of methods and models.
Sure, that’s next! Each of our trainings in our Statistically Speaking membership fits one of the steps. Sometimes for one specific type of model sometimes for multiple.
This is an interesting topic to my field of work.
Hi, Karen.
It’s was awesome guidelines. Can you share a journal o articles that express the guide like you did above? Maybe you own articles for my references.
inductive vs deductive?…theories inductive…facts..
Dear Karen
Very grateful for the 13 step guide sometimes taken for granted. The last step on interpretation is also critical just like all the other. Thank you.
Imelda
Wow I wish I’d had this at the start of my project. Thank you!
Hi,
thank you for sharing your valuable in information and explanation.
Satabdi
Thank you very much for the informative basic modeling approach with steps to follow. It was very much helpful for my exams and the modeling in the thesis.
This is *so* awesome!
I wish I had this when I started my PhD 18 months ago.
What a beautiful breakdown for the whole experimental process.
Every PhD student doing extensive data analysis should use this!
Thank you very much for the commitment consistent support
regarding to the above topics .forward to about test of assumption,interpret the result.
1. test of hypothesis (i’e if accept the null hypothesis H0=0,reject the null hypothesis H1 is different from Ho)
2.we can adjust alpha value (these alpha value are fixed by your study of literature review).
3. test statistics (these test statistics are fixed by your study i’e
your study variables of the predictors are quantitative we can use regression models (t-test (for small sample size and known variance,z-test for large sample and unknown variance and we can interpret by anova(analysis ofvariance can be used and interpret it ))))other wise we can use other statistical models like logistic regression for the independent variables are qualitative ,design of experiment,bio statistics …
4.we can compare the value of tabulated and calculated values (these is an important methods of deciding the rejecting and accepting the study)
5.regarding to the above observation we can interpret the values and we conclude them
if we interpret the result based on the study ,if the study result are reject the null hypothesis we can take action by that study other wise the study could be accept the null hypothesis we can’t take any action .
I thank you very much for your valuable information.
Thank you so much for this nice explanation.
We would like to know at what stage should you check normality of the data given this is an assumption that needs to hold for us to conduct regression test. Otherwise, i like the piece. It is very informative.
Hi Alen,
Actually, I have written an article about that. You may find it helpful: When to Check Model Assumptions
nice explanation
Hi Karen,
I want to build a model for number of days to recover money . Dependent variables are all nominal, made their dummy variables too.
will negative binomial distribution be appropriate?
with one key variable demandsent (4 levels) the outcome variable shows variance much higher than mean at all levels.
Interest of outcome variable varies from 0-356 from historical data actually upper limit there is no bound but days less than 0 is not interest.
Thanks.
Priti
Hi Priti,
I can’t really say what analysis you should use without understanding a lot more about your data, design, and variables. Negative binomial could be appropriate.
Thank you so much for this summarized and wonderful explannation. it is indeed educative.
Dear Karen,
I really enjoyed your threads and am amazed with the way you explain things that is understandable even to a beginner like me. Came across your website by accident while looking for chi-square vs logistic regression explanations. Thank you! A quick question: The place where I work is currently using a tool to categorize feeding difficulties in children and it has never been validated. BUT it has been widely used world wide (~8 countries) with studies proving its efficacy. Is it feasible to make a research using this tool without going through a validation study? Thanks very much !
Kaye
Hi Kaye,
I think it would really depend on those “studies proving its efficacy.” Are you saying it’s useful, but not necessarily valid?
Hi Karen,
Thanks for sharing insightful information. I’ve never conduct primary data and I’ve difficulties in understanding it as I am pretty skeptical with its validity. Nevertheless, is it possible to run regression using primary data from the question that you personally designed?
Regards
Ian
undergrads
Yes, it is. You do need to have solid study design for it to be valid, but assuming that, yes.
Hi Karen, I find these resources so useful, thanks for sharing! I have a quick question, I’m currently working on a project and using Quadratic general rotary unitized design approach, could you be having literature or links about this method? I have been able to find limited resources about this.
Thanks in advance.
Nick Tayari
PHD Candidate.
Hi Nick,
I’ve never heard of it. It could be very esoteric.
Thanks for such a good post.
This is really very good explanation. One thing I would like to know about false prediction rate in case of classification model. How to reduce the false prediction rate even if we go through all the steps[variable selection,data cleaning, multicolinearity tests] of the model improvements.
Thanks,
Amar
Hi Amar,
That’s a really big question to answer in detail. But here’s the short answer. Two ways:
1. Improve your model by including better predictors
2. change your classification cutoff. This won’t necessarily change the overall false prediction rate, but it will decrease false positives (or negatives, depending on which way to move it). This will be at the expense, though, of increasing false negatives. It depends on which is the worse error.