One of those tricky, but necessary, concepts in statistics is the difference between crossed and nested factors.
As a reminder, a factor is any categorical independent variable. In experiments, or any randomized designs, these factors are often manipulated. Experimental manipulations (like Treatment vs. Control) are factors.
Observational categorical predictors, such as gender, time point, poverty status, etc., are also factors. Whether the factor is observational or manipulated won’t affect the analysis, but it will affect the conclusions you draw from the results.
When there is only one factor in a design, you don’t have to worry about crossing and nesting. But once you have at least two factors, you need to understand whether they are nested or crossed. It’s an important design feature that affects the analyses you can and should conduct.
Crossing and Nesting
Two factors are crossed when every category of one factor co-occurs in the design with every category of the other factor. In other words, there is at least one observation in every combination of categories for the two factors.
A factor is nested within another factor when each category of the first factor co-occurs with only one category of the other. In other words, an observation has to be within one category of Factor 2 in order to have a specific category of Factor 1. All combinations of categories are not represented.
If two factors are crossed, you can calculate an interaction. If they are nested, you cannot because you do not have every combination of one factor along with every combination of the other.
When you’re not sure whether two factors in your design are crossed or nested, the easiest way to tell is to run a cross tabulation of those factors.
Here is an example. In this study, 27 men in their early 20s were randomized into one of three physical training groups. The subjects in every group–endurance, strength, and concurrent training regimens–were measured on a number of physical health measures at two time points: pre and post.
Group and Time are Crossed
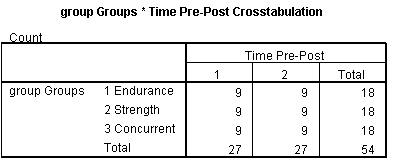
The two factors of interest–Training group and Time–are crossed, as there are 9 observations from each training group in each time. In other words, each Training group is represented at every Time point. This cross tabulation table shows this.
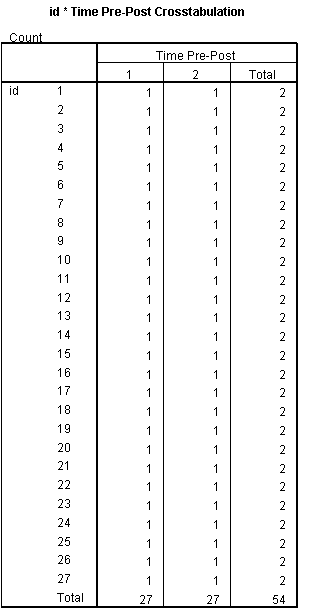
Subjects and Time are Crossed
However, there is a third factor that needs to be taken into account because it’s a repeated measures study: Subject.
If we had different people in each group, subject would not be an important factor and we could stop there. Groups and time would still be crossed. We would miss out on some of the efficiency advantages that we get from repeated measures, though, so let’s keep going.
In repeated measures, subject itself becomes a factor. Subject is crossed with time because each subject appears in every time point. Again, this is easy to see in the cross tabulation. Every subject has at least one value at every time point.
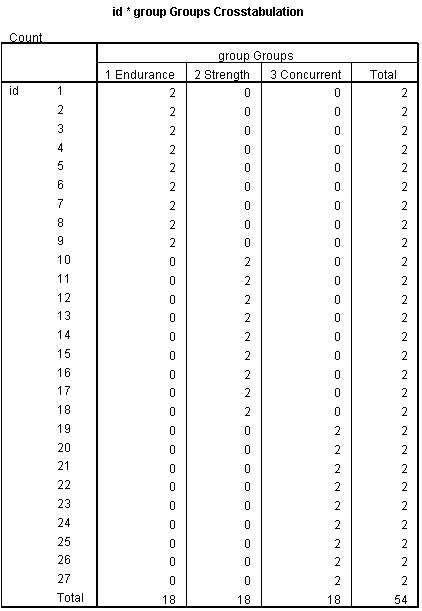
Subjects are Nested within Group
But you can see in the Subject*Groups cross tabulation that each subject has observations in only one group. Subjects 1-9 are in the Endurance training group only. Subjects 10-18 are in the Strength training group, etc. Because each subject was assigned to only one training group, subject and group are not crossed. Rather, subject is nested within training group.
In traditional multivariate approaches of analyzing repeated measures data, we ignore issues of nesting and crossing and use different names for these same concepts. Factors that Subject is nested within, like Training group, are called between-subjects factors. Factors that Subject is crossed with, like Time, are called within-subjects factors.
It also becomes extremely important in clustered designs, which don’t necessarily have repeated measures, but do have some sort of nesting of individuals within some larger group.
The combinations of nesting and crossing in designs with many factors can get quite complex. It gets even more confusing when you also have to decide whether to make factors fixed or random. Remember to use the cross tabulations to help you sort it out.

Please can you share with me the extended notes for this tpoic
Hi mentor Karen
Is mixed model analysis appropriate for the “hybrid between nesting and crossing” mentioned above? If not what model(s) should we use to analyze the data?
Thank you.
Yes, it is. If you’ve got both fixed and random factors, a mixed model is appropriate.
thanking you for nice explanation.
Kindly clarify me one thing. if some of the levels of one factor contain zero observation for some of the levels of second factor is it still considered as crossed? if i am correct it occurs in unbalanced design?
thanking you once again
It can depend on how many combinations of the levels of the two factors have zero observations.
For example, if most combinations are there and one or two combinations are missing, it would still be considered crossed. But there are definitely designs that are somewhere between crossed and nested where too many combinations are not there.
Hi,
I am in the process of designing a study. I have a between subjects design, one control group and one experimental group. Both groups will be taking part in a money allocation task as the DV.
What would be the relationship between my factors (Control and IV group?) This is a totally new concept to me! Thanks! 🙂
Hi Liv,
You only have one factor here: group. The factor is the categorical independent variable. In order for this to be crossed or nested, you would need a second factor in the model, which you don’t have.
Hi, and thank you very much for the very interesting topic. How would you go about this: I have three “block” replications. Within these I have three “treatment” plots (these are soil plots, 9 in total). within each plot I have six points where I collect “observations” (I take soil samples) . Within “observations” I have a three soil “horizons” (these are three layers of the soil that come from the same point but at different depths).
– I want to measure differences between “treatments” within the same soil “horizon”
– I also would like to measure differences between soil “horizons” (within the “treatment”)
My understanding is that “treatments” and “blocks” are crossed.
I am not sure if the soil “horizon” is nested within the “observation” (perhaps is this true only in the case where I want to measure differences between soil “horizons” within the “treatment)?
Many thanks in advance for your help.
Hi Mauro,
I can’t consult over the blog as I need to make sure I totally understand your design. You could take a look at our Statistically Speaking program there. I did a whole webinar in that about crossed and nested factors and we have weekly Q&As.
Can you discuss situations where the factors are incompletely crossed?
Here’s an example:
You have students and teachers in a high school. If there were only 5 teachers (one math teacher, one English teacher, one science teacher, etc.) so that every student had the same set of teachers, then student and teacher would be totally crossed.
Likewise, if there is a set up like an elementary school where each student has one teacher, then students are nested within teacher.
But if there are three math teachers, four English teachers, etc. and each student has 5 teachers, but not the same 5 teachers, then you’ve got a hybrid between nesting and crossing.
What about a situation where the categories of one factor have values of 0 in some of the categories of the other factor but >0 in other categories of that factor?
Dear all, please help me. i have faced a problem with design to do my experiment.
1. two districts selected purposely
2. 16 farmers selected purposely 8 from each district
those farmers divided in to two groups on basis of their status (experienced and non-experienced)
3. two chicken breeds given to the grouped farmers
so, what design fits this experiment????
HI KAREN
Regarding to the above explanation of the difference between cross and nested factor i have one question when we see the result’s are an interaction effect nested? or cross?
Thank you very much, you removed my doubts
How does a nested ANOVA or nested ANCOVA handle the fact the subject observations are violating the assumption of independent observation. Meaning, since the students are grouped within a classroom (nested) how does ANCOVA/ANOVA get around this lack of independent observations.
Hi Mark,
The only way to do that is with a mixed model. ANOVA can’t do it.
But wouldn’t the example of the participants in the nested groups be violating the assumption of independence? Could it be possible that the participants be competing? It is not as if they are separated into different rooms. For example, participants one through ten go to rooms one through ten. Wouldn’t the observation be influenced by the other participants in the group? Is it assumed in the example that the observations are independent and the fitness participants ignoring each other?
Very Nice
Thank you
Nice explanation!