Regression models, such as linear, logistic, time to event, and mixed models, measure the strength of the association between the dependent variable and the independent variables.
(more…)
regression models
Member Training: A Guide to Models for Causal Inference
January 31st, 2026 by TAF SupportThe Data Analysis Pathway: Steps for Running any Statistical Analysis
September 10th, 2024 by Karen Grace-MartinNo matter what statistical model you’re running, you need to take the same steps. The order and the specifics of 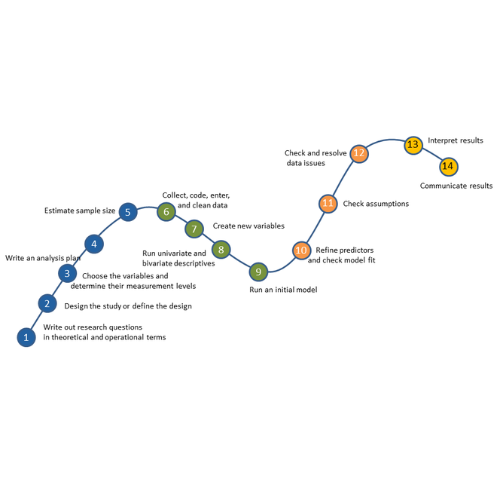 how you do each step will differ depending on the data and the type of model you use.
These steps are in 4 phases. Most people think of only the third as modeling. But the phases before this one are fundamental to making the modeling go well. It will be much, much easier, more accurate, and more efficient if you don’t skip them.
And there is no point in running the model if you skip the last phase. That’s where you communicate the results.
I’ve found that if I think of them all as part of the analysis, the modeling process is faster, easier, and makes more sense.
Phase 1: Define and Design
In the first five steps of running the model, the object is clarity. You want to make everything as clear as possible to yourself. The clearer things are at this point, the smoother everything will be. (more…)
Beyond R-squared: Assessing the Fit of Regression Models
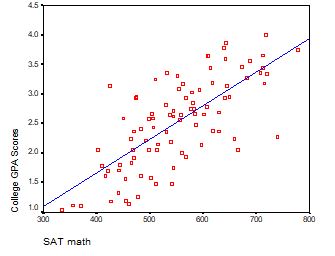
February 20th, 2024 by Karen Grace-Martin A well-fitting regression model results in predicted values close to the observed data values. The mean model, which uses the mean for every predicted value, generally would be used if there were no useful predictor variables. The fit of a proposed regression model should therefore be better than the fit of the mean model. But how do you measure that model fit?
Interpreting the Intercept in a Regression Model
February 21st, 2023 by Karen Grace-MartinInterpreting the Intercept in a regression model isn’t always as straightforward as it looks.
Here’s the definition: the intercept (often labeled the constant) is the expected value of Y when all X=0. But that definition isn’t always helpful. So what does it really mean?
Regression with One Predictor X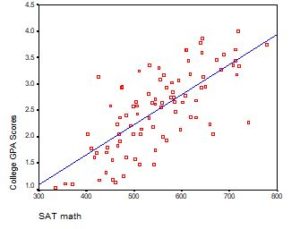
Start with a very simple regression equation, with one predictor, X.
If X sometimes equals 0, the intercept is simply the expected value of Y at that value. In other words, it’s the mean of Y at one value of X. That’s meaningful.
If X never equals 0, then the intercept has no intrinsic meaning. You literally can’t interpret it. That’s actually fine, though. You still need that intercept to give you unbiased estimates of the slope and to calculate accurate predicted values. So while the intercept has a purpose, it’s not meaningful.
Both these scenarios are common in real data. (more…)
When Linear Models Don’t Fit Your Data, Now What?
June 20th, 2022 by Karen Grace-MartinWhen your dependent variable is not continuous, unbounded, and measured on  an interval or ratio scale, linear models don’t fit. The data just will not meet the assumptions of linear models. But there’s good news, other models exist for many types of dependent variables.
Today I’m going to go into more detail about 6 common types of dependent variables that are either discrete, bounded, or measured on a nominal or ordinal scale and the tests that work for them instead. Some are all of these.
Member Training: Difference in Differences
November 30th, 2021 by Jeff Meyer The great majority of all regression modeling explores and tests the association between independent and dependent variables. We are not able to claim the independent variable(s) has a causal relationship with the dependent variable. There are five specific model types that allow us to test for causality. Difference in differences models are one of the five.