When your dependent variable is not continuous, unbounded, and measured on  an interval or ratio scale, linear models don’t fit. The data just will not meet the assumptions of linear models. But there’s good news, other models exist for many types of dependent variables.
Today I’m going to go into more detail about 6 common types of dependent variables that are either discrete, bounded, or measured on a nominal or ordinal scale and the tests that work for them instead. Some are all of these.
Distributional Assumptions in Linear Models
Let’s take a moment to review the assumptions that will fail here.
Two key assumptions about the errors in linear models are that they all come from the same normal distribution and that they have a constant variance. There are more assumptions, but those are the ones we’re focusing on here.
 These errors are in the population, but we estimate them with the sample residuals to check the feasibility of these assumptions.
There are many data sets with variables that could theoretically follow these assumptions, but don’t. Here we’re talking about dependent variables that just won’t ever give you the residual distribution linear models need. So you can try fitting a linear model and then testing the assumptions, but it will pretty much always fail.
The usual advice is to do one of two things. One is to transform your dependent variable. And that can definitely work in some situations. But not for these variables.
The other is to use nonparametric tests when normality assumptions fail. That works when you’re doing something simple, like a correlation or comparing group means. But if you’re including covariates or interactions in a model, you need a real model.
Categorical Dependent Variables
![]() Both binary (2 values) and multicategory (3 or more values) variables clearly fail all three criteria. But there are other types of regression models that work just fine for these variables.
Both binary (2 values) and multicategory (3 or more values) variables clearly fail all three criteria. But there are other types of regression models that work just fine for these variables.
For binary variables, probit and logistic regression models are the most common. For multicategorical variables, use multinomial logistic regression.
Ordinal Variables
These variables are made up of ordered categories. They include rank and likert-item variables, although are not limited to these.
Although ordinal variables look like numbers, the distances between their values aren’t equal in a true numerical sense. So it doesn’t make sense to apply numerical operations like addition and division to them. Hence means, the basis of linear models, don’t really compute.
Like unordered categorical variables, ordinal variables require specialized logistic or probit models, such as the proportional odds model. There are a few other types of ordinal models, but the proportional odds model is most commonly available.
Count Variables
Discrete counts fail the assumptions of linear models for many reasons. The most obvious is that the normal distribution of linear 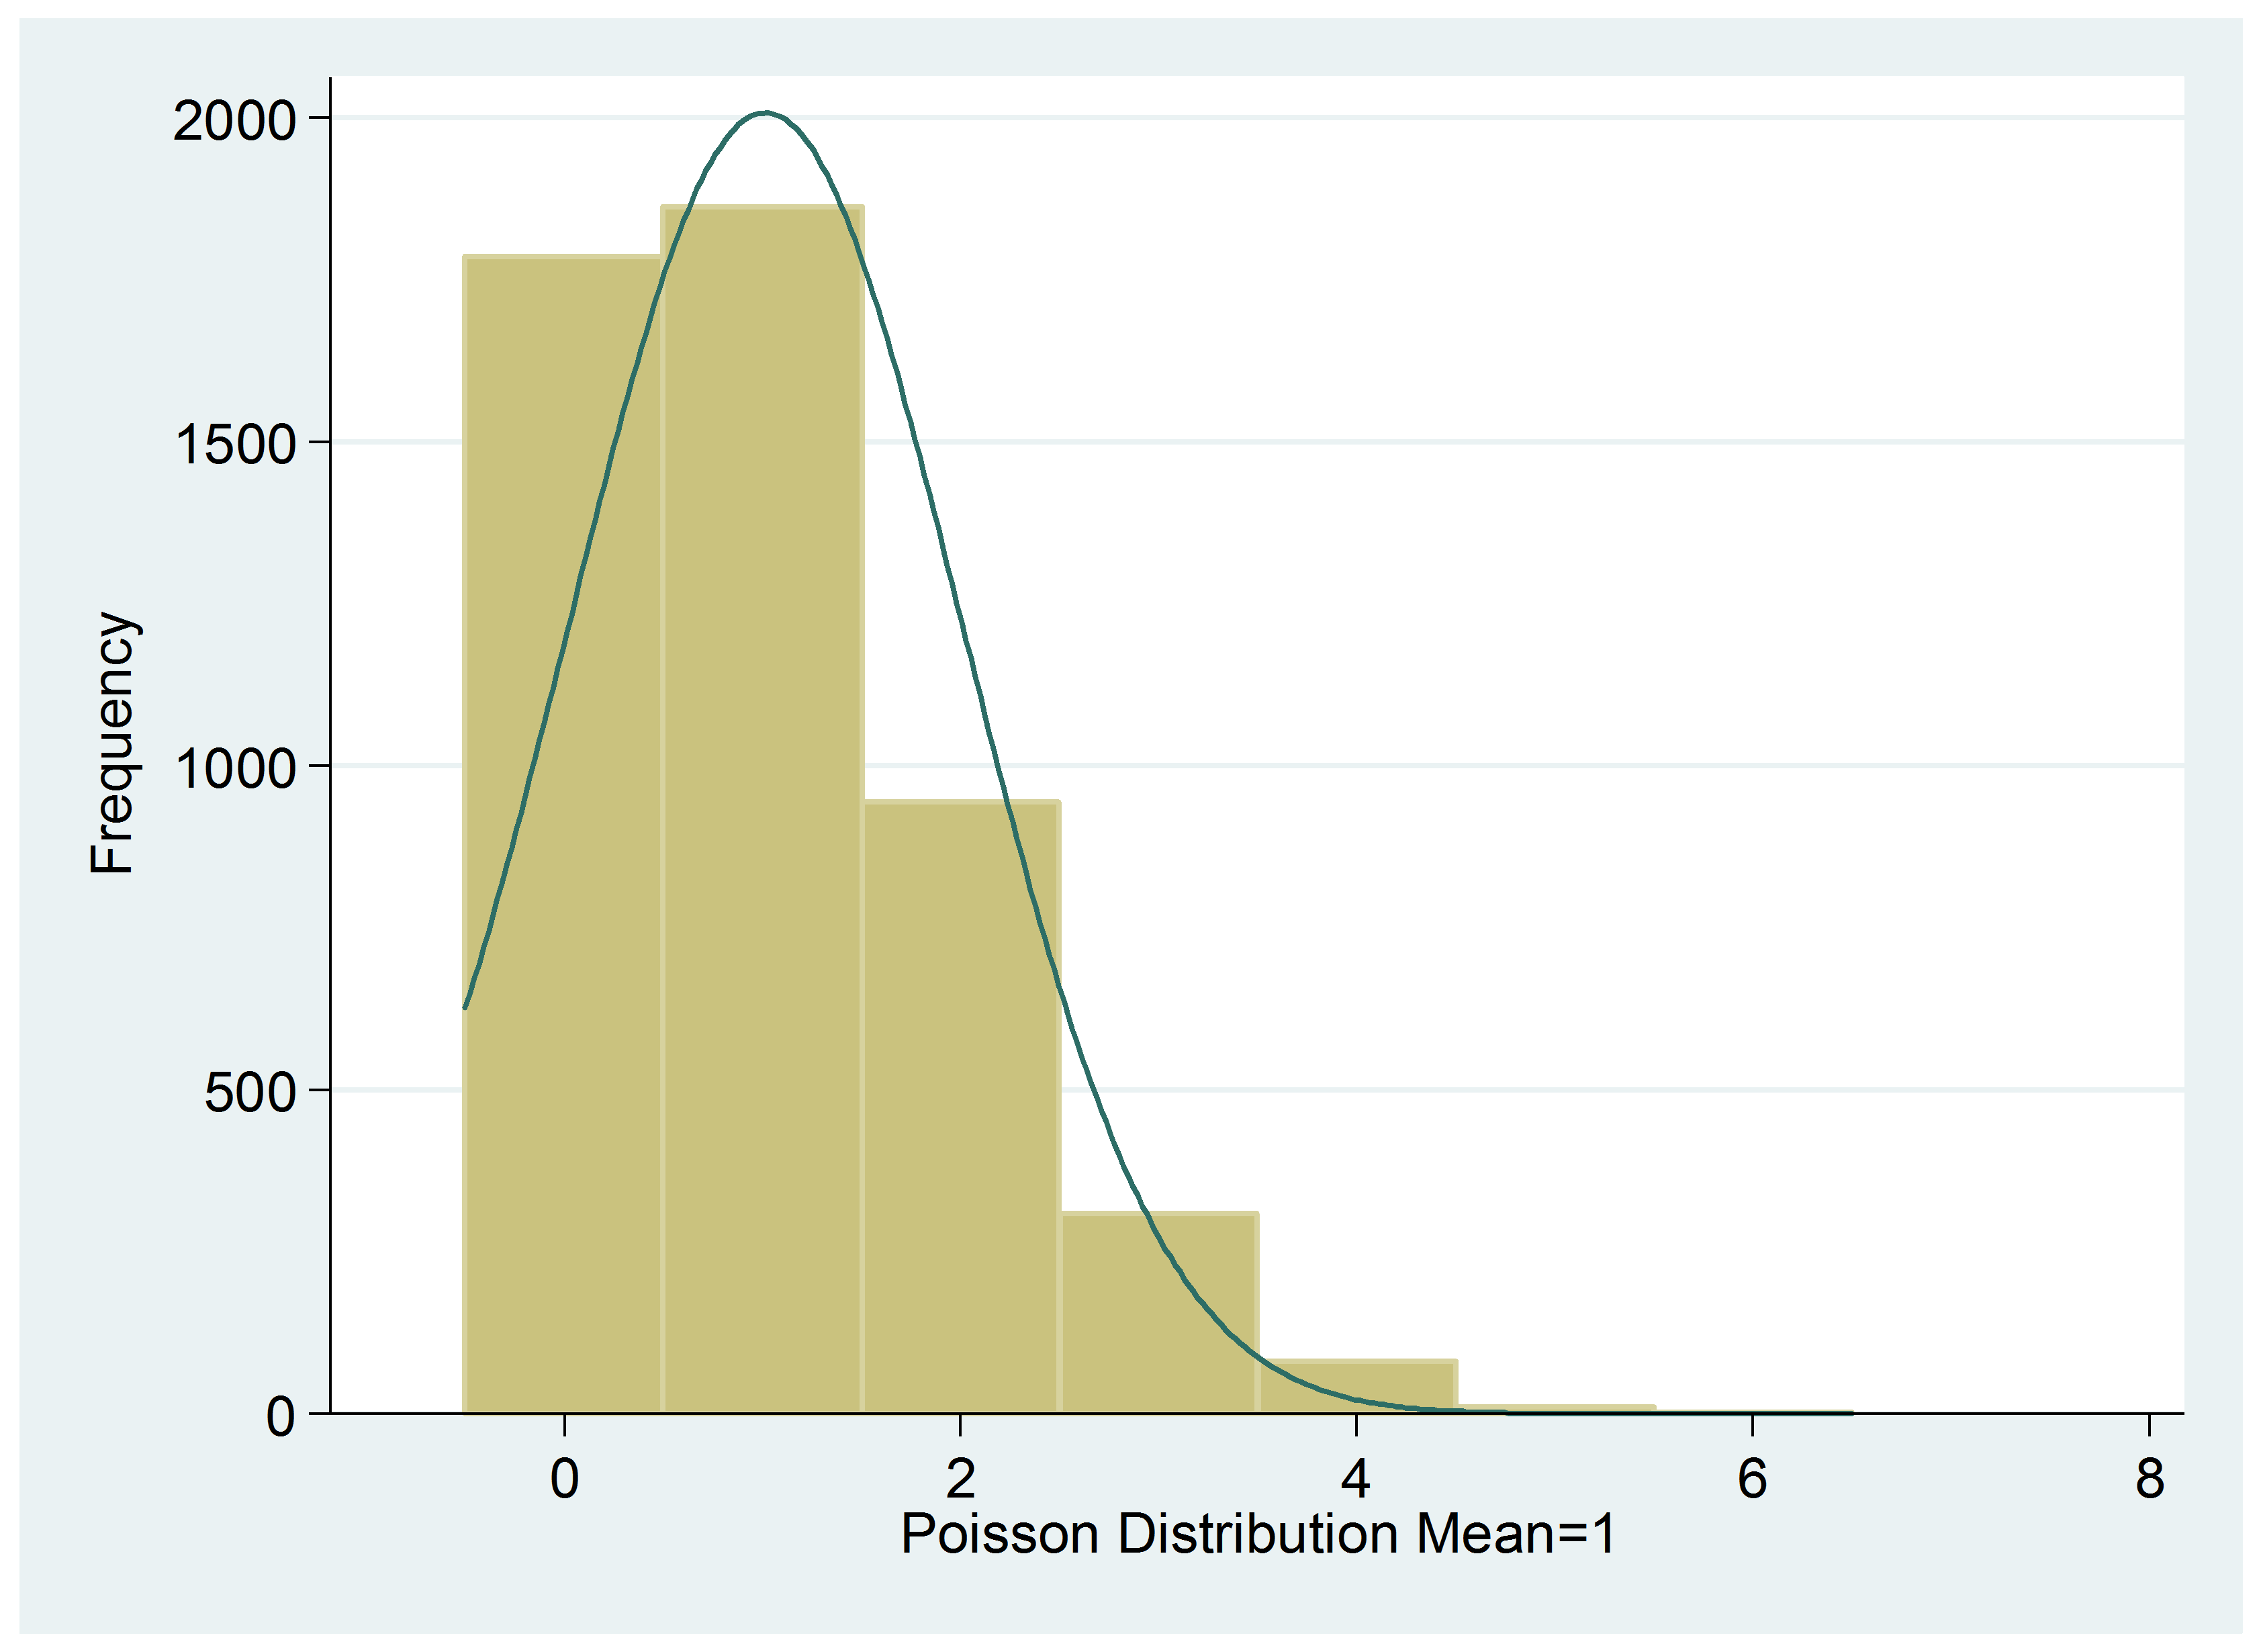 models allows any value on the number scale, but counts are bounded at 0. It just doesn’t make sense to predict negative numbers of cigarettes smoked each day, children in a family, or aggressive incidents.
But Poisson regression, or related models like negative binomial, are designed to accurately model count data.
Zero Inflated Variables
![]() Zero Inflated data have a spike in the distribution at 0.
Zero Inflated data have a spike in the distribution at 0.
They are common in Poisson data, but can occur with any distribution. A recent example I saw were scores on a depression scale. The scale ran from 0 to 20, and 0 was by far the most common value (which is a good thing for the state of humanity, but it really messes up the linear model assumptions).
Even if the rest of the distribution is normal, you can’t transform zero inflated data to look normal. A Zero-Inflated model, however, incorporates the high number of zeros by simultaneously modeling 0/Not 0 as a logistic regression and all the Not 0 values as another distribution. It’s pretty cool, actually.
Censored Variables
Censored data have full information about the values of the DV only for some values. The distribution gets cut off for some values, often at the end of the distribution.
Examples include surveys that have exact income information for everyone up to $200k, but beyond that, everyone is just given “over $200k.” In surveys, this is done for privacy issues–there just aren’t many people with such high incomes.
But sometimes it’s just a measurement issue. Tobit regression models are designed to handle the imprecise measurements on some parts of the scale.
Proportions
Proportions, bounded at 0 and 1, or percentages, bounded at 0 and 100, really become problematic if much of the data are close to ![]() the bounds.
the bounds.
If all the data fall in the middle portion, say in the .2 to .8 range, a linear model can give reasonably good results. But beyond that, you need to either use a beta regression if the proportion is continuous or logistic regression if the proportion measures discrete events with a certain outcome (proportion of questions answered correctly).
Generalized Linear Models
So the next time linear models don’t fit your data, consider a different type of model.
Most of the models I’ve described here fit into the family of regression models called Generalized Linear Models. If you ever work with any of the variables described here, it’s worth learning them.

IT DATA LINIER GENERAL OR GENERAL IS LINIER OR PARABOLA. MAPING GENERAL IS (ARE) GENERAL LINIER PROGRAMMING FIT DATA.
IT IS NOT FIT LINIER PROGRAME . IT CHOOSING PROGRAME OTHER IS . MAPING GENERAL PROGRAME IS FIND AND FIT IT.
I am collected all required data to analyze my MSc thesis and when i tried to enter that data into spss, Types of variables wants to confuse me. and now thank you, this post helped me well at right time.
Hi, Karen. Thanks for this helpful information. Ordered probit is a proportional odds model, is that right? I’ve heard that if an ordinal dependent variable has enough levels, OLS can be used. Is this accurate? Thank you!
Dear Karen!
Thanks for the interesting post.
If dependent variable is zero inflated continous variable (more zeros with both negative and possitive values between 0 and 1), what are the appropreate regression types? (independetnvariables have both continous and categorical variables)
Thank you
Hi Mark,
It’s hard to say without looking at it and getting all the details. It’s possible you could just do a linear regression. Run one and take a look at the distribution of the residuals. They may look normal.
Or it may be that 0 is qualitatively different in some way than the other values, in which case you’d need a zero inflated model.
Dear Karen,
I would like to direct you my question, as I am struggling with my data analysis using binary logistic regression. In my study, the dependent variable is dichotomous, because of that I used binary logistic regression to analyze the data(Spss program).
I got the results, but beta coefficients do not make sense because the values are greater than 1. now I am struggling with transforming beta coefficient to meaningful values.
Could you please advise me on this problem.
Thank you.
Ishanka
I have a response which is a measure of the severity of an accident, valued from 0 to 100 (integer). Which family in GLM should I use? Poisson? Binomial? or Gamma?
HI karen,
I’m a student who is dealing with a survey for the first time.
I have a lot of variables but i want to choose the frequency of someone’s buying a product as the dependent variable for a linear regression model
it shows up like this 1=always; 2=2-3 times in a week; 3=1 once in a week; 4=once in a month; 5=almost never
and for another product liket this:
never,almost never,once in a week,2 times in a week
is it correct to use one of these two as a dependent variable in a linear regression model? i thought that the classe must be continuos inside them and among them,the first one doesn’t seem to be continuous among classes,while second seem! thank you for your answer
I have used ECSI model to measure customer satisfaction and loyalty and also collected customer Socio demographic and personal characteristics (categorical in nature) and wanted to run logit regression to know the influence of such categorical factors on loyalty. My problem is, dependent variable is scale in nature (Likert) which is a summated average score of ECSI model. I converted the dependent variable on the basis of summated average score those are below the average is denoted as o and above average denoted as 1. like this i have divided into binary DV.
In this regard i need your kind suggestion is it a valid way to convert the scale dependent variable to binary DV, specially looking to the study.
Kindly help me sir so that i can take forward my research. If so i need citation for the same. Kindly help me.
Hi I have recently completed a log regression of 1 categorical variable vs 4 dependent variables. I have found the z score and chi values for these regressions however now I would like to know how i could rank the values within these variables to find “confidence intervals” ie if the value of the dependant variable is above X value what is the confident that this will cause the categorical variable to be “yes” or “no” for example.
Thanks
Alberto
Hey Karen
thank you for the helpful post.
I actually have a zero-inflated data problem and when running planned comparison on a glm model just doesn’t like to compare the mean between two different but “identical” (having exactly all the same values) populations.
Any suggestion on how to deal with that? I assume the problem is due to all the zeros I have in the two population, but seems like even manipulating the data by adding a 1 (my dependent variable is binary) each the problem persist…so I guess planned comparisons in glm just really don’t like samples having identical values…
(and no I can’t take out the comparison since is part of of the model)
Hi Karen,
Very useful post. I have data of more than 8000 observations. My dependent variable is a binary variable consists on 0 and 1 only. Around 97% of the dependent variable values are zero. When I plot residual histogram, I see a big spike around zero (towards negative side of the zero, i.e.,[-1,0] interval), and extremely small spikes left of the zero spike and right of the zero spike at residual value of around 2. I estimated GLM and GAM with logistic regression. Can I improve upon my estimation here, ideally to show me a symmetric histogram for residuals? Thank you. Kind Regards, Aziz
Hi.. I have a dichotomous dep var and covariates are categorical(sex, birth loc and another ones are 5 point likert scale variables). I am using binary logistic regression. Is it right?
Hi Karen,
Firstly thank you for this helpful article.
I have three proportion DVs and most of the data are very close to the bounds and the proportions across the three DVs all add to 100%.
Unfortunately I can’t find a way to include all three DVs in one analysis like you would do in multivariate. Do you think it would be ok to do three different sets of binomial regressions (events/trials) in GLM for each DV or am I risking bias/errors?
Thanks.
Hi Matthew,
Hmm, if they add to 100%, do you really need all three. If you know each persons’ answer to two, you know their answer to the third, right?
This is a tricky one…
Karen
Hi,
i have panel data and the dependent variable is a calculated ratio. The explanatory variables consist of some macroeconomic indicators and other control variables. The aim of the analysis is to use variations in the Xs to explain the existence of cycles (given by fluctuations in Y). However, I am quite unsure about which model best fits the data. I’d be pleased to get a few suggestions.
Thanks.
Hi Sherryll,
As always, it depends on all the details. Is it a ratio that is bounded anywhere? Some are bounded, for example at 0 and 1, but not all are.
What exactly constitutes a “huge spike in the distribution at 0”? Is there a numeric cut off, perhaps if 50% of the participants scored a zero then one should implement a zero inflated model?
Hi Karen,
I apologise in advance if my question appears too rudimentary, but the statistics textbooks provide no clear answer, and my presence here is evidence of my research online.
1. I have a series of likert scale questionnaires that I want to check for mean differences in scores according to the different conditions of my IV (x4 levels). I have carried out a reliability analysis; the Cronbach alpha’s are mostly acceptable. What is the acceptable way (my discipline is Social Science) to transform the different scores for each person for each questionnaire into a single score (is this what I have to do?)
2. For my second study, the questionnaires were responded to first before participants were divided into different treatments of my IV ( x4 levels) followed by responding to two more questionnaires (my DVs). I predicted that high scores on the initial questionnaires will predict high scores on the DVs if IV level = W & X, and the inverse if IV level = Y & Z.
Your response will be greatly appreciated. I am a self-funded doctorate student, a bit isolated, and statistics is not my adviser’s strongest point.
Thanks,
Ian Potter
Hi, I like this post, I have a question, mi set data is only one numerical variable (egg per gram of feces) and the others are categorical (sex, category age, etc) can I make a GLMM with this set data?
Hello,
I have as a response variable minutes spent feeding, which looks skewed to the left. Someone suggested me using a Gamma distribution, but I am not too sure. Any suggestions? To put it into context I want to know whether diameter of a tree (DBH), tree species or/and season has an effect on the duration of an animal spends feeding on a specific tree. Thanks!
Hi karen,
I would like to know how likert scale can be changed to logistic regression?
Hi Endriyas,
The scale wouldn’t be changed (usually). You just need ordinal logistic regression. I would start with this webinar on logistic regression. It’s a free download.
Hi Karen,
Thanks for the interesting post. I have proportional data that is zero-inflated – the proportion of a carivores’ diet consisting of small mammals, with lots of results recording no small mammals at all.
Would this be a zero-inflated tobit regression? Is there such a thing??
Thanks
Laura
Hi Laura,
Sounds like it. I haven’t heard specifically of a zero-inflated tobit model, but it could exist. Zero inflated models are part of a class of models called mixture models, which combine two models.
I find this post very confusing – GLM typically stands for generalized linear models which were formulated as a way of unifying various other statistical models, including linear regression, logistic regression and Poisson regression.
Hi Cory, it’s one of those confusing terms. GLM also stands for General Linear Model, which is what I meant here.
Karen, thanks for the information you give here. It’s very helpful.
I have a question. Is it correct to use a generalized linear mixed model when my data are percentages? Thank you.
Stan
It could be. Usually percentages (proportions, actually) either have to be considered binomial or possibly a beta distribution (although for a beta distributions, there can’t be any 0 or 1 proportions). Both would work in a GLMM.
Can i use Poisson or one of count data model for the out comes of the dependent variable contains only o,1,2,3 and 4
Potentially. Is it truly a count? You can always run in then check assumptions. If they’re met, then sure.
Karen