• Skip to primary navigation
  • Skip to main content
  • Skip to primary sidebar
The Analysis Factor

The Analysis Factor

Statistical Consulting, Resources, and Statistics Workshops for Researchers

  • Home
  • About
    • Our Programs
    • Our Team
    • Our Core Values
    • Our Privacy Policy
    • Employment
    • Guest Instructors
  • Membership
    • Statistically Speaking Membership Program
    • Login
  • Workshops
    • Online Workshops
    • Login
  • Consulting
    • Statistical Consulting Services
    • Login
  • Free Webinars
  • Contact
  • Login

Proportion

Member Training: Interpretation of Effect Size Statistics

by guest

Effect size statistics are required by most journals and committees these days ⁠— for good reason. 

They communicate just how big the effects are in your statistical results ⁠— something p-values can’t do.

But they’re only useful if you can choose the most appropriate one and if you can interpret it.

This can be hard in even simple statistical tests. But once you get into  complicated models, it’s a whole new story. [Read more…] about Member Training: Interpretation of Effect Size Statistics

Tagged With: Cohen's d, Correlation, correlation indexes, effect size, effect size statistics, empirically derived, Glass, Hedges, interpreting, null hypothesis, probability of superiority, Proportion, strength association, superiority, variance

Related Posts

  • Member Training: Statistical Rules of Thumb: Essential Practices or Urban Myths?
  • Member Training: An Overview of Effect Size Statistics and Why They are So Important
  • September Member Training: Inference and p-values and Statistical Significance, Oh My!
  • Member Training: Confusing Statistical Terms

Member Training: Equivalence Tests and Non-Inferiority

by guest Leave a Comment

Statistics is, to a large extent, a science of comparison. You are trying to test whether one group is bigger, faster, or smarter than another.
 
You do this by setting up a null hypothesis that your two groups have equal means or proportions and an alternative hypothesis that one group is “better” than the other. The test has interesting results only when the data you collect ends up rejecting the null hypothesis.
 
But there are times when the interesting research question you’re asking is not about whether one group is better than the other, but whether the two groups are equivalent.

[Read more…] about Member Training: Equivalence Tests and Non-Inferiority

Tagged With: equivalence, experiments, hypothesis testing, invariance testing, margin of non-inferiority, measurement equivalence, non-inferiority test, Proportion

Related Posts

  • Member Training: Confidence Intervals
  • January Member Training: A Gentle Introduction To Random Slopes In Multilevel Models
  • September Member Training: Inference and p-values and Statistical Significance, Oh My!
  • Member Training: Explaining Logistic Regression Results to Non-Researchers

How to do a Chi-square test when you only have proportions and denominators

by guest 31 Comments

by Annette Gerritsen, Ph.D.

In an earlier article I discussed how to do a cross-tabulation in SPSS. But what if you do not have a data set with the values of the two variables of interest?

For example, if you do a critical appraisal of a published study and only have proportions and denominators.

In this article it will be demonstrated how SPSS can come up with a cross table and do a Chi-square test in both situations. And you will see that the results are exactly the same.

‘Normal’ dataset

If you want to test if there is an association between two nominal variables, you do a Chi-square test.

In SPSS you just indicate that one variable (the independent one) should come in the row, [Read more…] about How to do a Chi-square test when you only have proportions and denominators

Tagged With: chi-square test, Proportion, SPSS

Related Posts

  • Statistical Software Access From Home
  • Same Statistical Models, Different (and Confusing) Output Terms
  • Member Training: What’s the Best Statistical Package for You?
  • Tricks for Using Word to Make Statistical Syntax Easier

When Dependent Variables Are Not Fit for Linear Models, Now What?

by Karen Grace-Martin 28 Comments

When your dependent variable is not continuous, unbounded, and measured on an interval or ratio scale, your model will not meet the assumptions of linear models.

Today I’m going to go into more detail about 6 common types of dependent variables that are not continuous, unbounded, and measured on an interval or ratio scale and the tests that work instead.

Side note: the usual advice is to use nonparametric tests when normality [Read more…] about When Dependent Variables Are Not Fit for Linear Models, Now What?

Tagged With: binary variable, categorical variable, Censored, dependent variable, Discrete Counts, Multinomial, ordinal variable, Poisson Regression, Proportion, Proportional Odds Model, regression models, Truncated, Zero Inflated

Related Posts

  • 6 Types of Dependent Variables that will Never Meet the Linear Model Normality Assumption
  • Member Training: Types of Regression Models and When to Use Them
  • When to Check Model Assumptions
  • Proportions as Dependent Variable in Regression–Which Type of Model?

6 Types of Dependent Variables that will Never Meet the Linear Model Normality Assumption

by Karen Grace-Martin 11 Comments

The assumptions of normality and constant variance in a linear model (both OLS regression and ANOVA) are quite robust to departures.  That means that even if the 
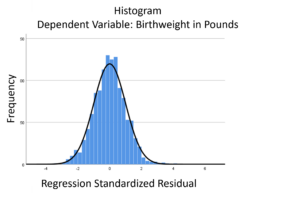
assumptions aren’t met perfectly, the resulting p-values will still be reasonable estimates.

But you need to check the assumptions anyway, because some departures are so far that the p-value become inaccurate.  And in many cases there are remedial measures you can take to turn non-normal residuals into normal ones.

But sometimes you can’t.

Sometimes it’s because the dependent variable just isn’t appropriate for a linear model.  The [Read more…] about 6 Types of Dependent Variables that will Never Meet the Linear Model Normality Assumption

Tagged With: Assumptions, categorical outcome, categorical variable, Censored, Constant Variance, dependent variable, Discrete Counts, normality, ordinal variable, Proportion, Truncated, Zero Inflated

Related Posts

  • When Dependent Variables Are Not Fit for Linear Models, Now What?
  • When to Check Model Assumptions
  • Statistical Models for Truncated and Censored Data
  • Member Training: Types of Regression Models and When to Use Them

Proportions as Dependent Variable in Regression–Which Type of Model?

by Karen Grace-Martin 13 Comments

When the dependent variable in a regression model is a proportion or a percentage, it can be tricky to decide on the appropriate way to model it.

The big problem with ordinary linear regression is that the model can predict values that aren’t possible–values below 0 or above 1.  But the other problem is that the relationship isn’t linear–it’s sigmoidal.  A sigmoidal curve looks like a flattened S–linear in the middle, but flattened on the ends.  So now what?

The simplest approach is to do a linear regression anyway.  This approach can be justified only in a few situations.

1. All your data fall in the middle, linear section of the curve.  This generally translates to all your data being between .2 and .8 (although I’ve heard that between .3-.7 is better).  If this holds, you don’t have to worry about the two objections.  You do have a linear relationship, and you won’t get predicted values much beyond those values–certainly not beyond 0 or 1.

2. It is a really complicated model that would be much harder to model another way.  If you can assume a linear model, it will be much easier to do, say, a complicated mixed model or a structural equation model.  If it’s just a single multiple regression, however, you should look into one of the other methods.

A second approach is to treat the proportion as a binary response then run a logistic or probit regression.  This will only work if the proportion can be thought of and you have the data for the number of successes and the total number of trials.  For example, the proportion of land area covered with a certain species of plant would be hard to think of this way, but the proportion of correct answers on a 20-answer assessment would.

The third approach is to treat it the proportion as a censored continuous variable.  The censoring means that you don’t have information below 0 or above 1.  For example, perhaps the plant would spread even more if it hadn’t run out of land.  If you take this approach, you would run the model as a two-limit tobit model (Long, 1997).  This approach works best if there isn’t an excessive amount of censoring (values of 0 and 1).

Reference: Long, J.S. (1997). Regression Models for Categorical and Limited Dependent Variables. Sage Publishing.

Tagged With: dependent variable, linear regression, logistic regression, percentage data, Proportion, Tobit Regression

Related Posts

  • Member Training: Types of Regression Models and When to Use Them
  • When Dependent Variables Are Not Fit for Linear Models, Now What?
  • When to Use Logistic Regression for Percentages and Counts
  • Member Training: Using Excel to Graph Predicted Values from Regression Models

Primary Sidebar

This Month’s Statistically Speaking Live Training

  • January Member Training: A Gentle Introduction To Random Slopes In Multilevel Models

Upcoming Workshops

  • Logistic Regression for Binary, Ordinal, and Multinomial Outcomes (May 2021)
  • Introduction to Generalized Linear Mixed Models (May 2021)

Read Our Book


Data Analysis with SPSS
(4th Edition)

by Stephen Sweet and
Karen Grace-Martin

Statistical Resources by Topic

  • Fundamental Statistics
  • Effect Size Statistics, Power, and Sample Size Calculations
  • Analysis of Variance and Covariance
  • Linear Regression
  • Complex Surveys & Sampling
  • Count Regression Models
  • Logistic Regression
  • Missing Data
  • Mixed and Multilevel Models
  • Principal Component Analysis and Factor Analysis
  • Structural Equation Modeling
  • Survival Analysis and Event History Analysis
  • Data Analysis Practice and Skills
  • R
  • SPSS
  • Stata

Copyright © 2008–2021 The Analysis Factor, LLC. All rights reserved.
877-272-8096   Contact Us

The Analysis Factor uses cookies to ensure that we give you the best experience of our website. If you continue we assume that you consent to receive cookies on all websites from The Analysis Factor.
Continue Privacy Policy
Privacy & Cookies Policy

Privacy Overview

This website uses cookies to improve your experience while you navigate through the website. Out of these, the cookies that are categorized as necessary are stored on your browser as they are essential for the working of basic functionalities of the website. We also use third-party cookies that help us analyze and understand how you use this website. These cookies will be stored in your browser only with your consent. You also have the option to opt-out of these cookies. But opting out of some of these cookies may affect your browsing experience.
Necessary
Always Enabled

Necessary cookies are absolutely essential for the website to function properly. This category only includes cookies that ensures basic functionalities and security features of the website. These cookies do not store any personal information.

Non-necessary

Any cookies that may not be particularly necessary for the website to function and is used specifically to collect user personal data via analytics, ads, other embedded contents are termed as non-necessary cookies. It is mandatory to procure user consent prior to running these cookies on your website.