Just about everyone who does any data analysis has used a chi-square test. Probably because there are quite a few of them, and they’re all useful.
But it gets confusing because very often you’ll just hear them called “Chi-Square test” without their full, formal name. And without that context, it’s hard to tell exactly what hypothesis that test is testing.
In this article I’ll review three of the most common and explain what makes a chi-square test a chi-square test.
What makes a test a Chi-Square test?
All chi-square tests have a test statistic that follows a chi-square distribution. This is simply a statistical distribution, just like a normal, uniform, or Poisson distribution. The general shape of the chi-square distribution is skewed to the right. The exact shape, which affects the p-value associated with each value of the test statistic, is determined by the degrees of freedom.
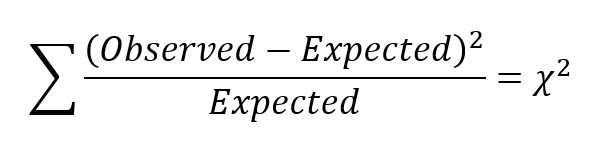
The three tests below all use the same Chi-square test statistic, which is calculated with the same formula. All of them use only categorical variables. But they answer different research questions and the values we put into the formula come from different places.
Chi-Square Test of Independence
The Test of Independence tests the null hypothesis that two (or more) categorical variables are unassociated or independent of each other. In other words, knowing the value of one doesn’t help you know the value of the other. It’s similar in concept to a test of correlation—there is no independent or dependent variable, just a test of association.
Chi-Square Goodness of fit Test
This tests a completely different null hypothesis for one categorical variable: “do the set of values of this variable fit a specified distribution?” This gets confusing, because the specified distribution in question is not the chi-square distribution of the test statistic.
Rather, you may be testing whether a categorical variable has a uniform (equal) distribution across all categories. If so, we’d expect the frequency of each category to be equal.
Chi-Square Test of Homogeneity
The Chi-Square Test of Homogeneity looks and runs just like a chi-square test of independence. But there is a slight difference. The test of homogeneity tests the null hypothesis: “Is the distribution of this categorical variable the same within these populations?”
In other words, there is a clear independent variable—the population groups—and a clear dependent variable, whose distributions we’re comparing. So if a Test of Independence is like a test of correlation, the Test of Homogeneity is like a simple linear regression (one predictor). We’ll get the same test statistic and p-value, but we draw slightly different conclusions.
The Chi-Square Test Statistic
All these tests compare the frequency of observations in a specific category or combination of categories to the frequency that would be expected under the null hypothesis. The further the observed values are from those expected by the null hypothesis, the bigger the test statistic.
As it turns out, this test statistic will approximately follow a chi-square distribution under certain circumstances. This is important because it’s the distribution that allows us to get a p-value. Generally, the approximation is considered acceptably accurate if two conditions hold:
- The value of Expected in all categories ≥ 1
- The value of Expected in 80% of categories ≥ 5
Most statistical software will give you a warning if both of these are not met. That generally occurs when samples are too small. Luckily, there are other options, like Fisher’s exact tests, that work in those situations.
Leave a Reply