• Skip to primary navigation
  • Skip to main content
  • Skip to primary sidebar
The Analysis Factor

The Analysis Factor

Statistical Consulting, Resources, and Statistics Workshops for Researchers

  • our programs
    • Membership
    • Online Workshops
    • Free Webinars
    • Consulting Services
  • statistical resources
  • blog
  • about
    • Our Team
    • Our Core Values
    • Our Privacy Policy
    • Employment
    • Collaborate with Us
  • contact
  • login

independence

The Difference between Chi Square Tests of Independence and Homogeneity

by Kim Love  Leave a Comment

A chi square test is often applied to two-way tables, like the one below.

A table of Union Status by Gender for Employed Individuals in 2020 (adapted from Current Population Survey, Bureau of Labor Statistics)
 

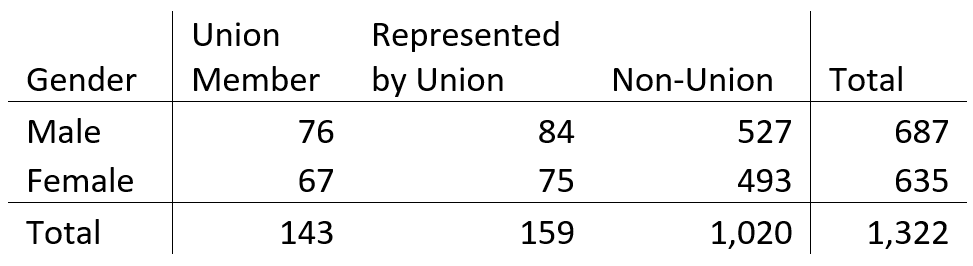
This table represents a sample of 1,322 individuals. Of these individuals, 687 are male, and 635 are female. Also 143 are union members, 159 are represented by unions, and 1,020 are not affiliated with a union.

You might use a chi-square test if you want to learn something about the relationship of gender and union status. The question then might come up: should you use a test of independence, or a test of homogeneity?

Does it matter? Software doesn’t generally differentiate between the two, which leads to a final question: are they even different?

Well, yes and no. Read on!

Different: Independence versus Homogeneity

Independence and homogeneity do refer to different ideas. If union status and gender are independent, that means that union status and gender are unrelated. In other words, if you know someone’s union status, you won’t be able to make a better guess as to their gender.

If you know someone’s gender, you won’t be able to make a better guess as to their union status.

Homogeneity is different and refers to the concept of similarity. If you are familiar with linear regression, you might associate this with residuals. Residuals should be homogeneous, meaning they all come from the same distribution.

That idea applies to this two-way table as well. We may want to know if the distribution of union status is the same for men and women. In other words, does union status come from the same distribution for both men and women?

To test independence, we would not approach the question from the standpoint of gender or union status. We would take a sample of all employed individuals, and then break them down into the categories in the table.

To test homogeneity, we would approach it from the standpoint of gender. We would randomly sample individuals from within each gender, and then measure their union status.

Either approach would result in the table above.

Same: Chi-Square Statistics

Chi-square statistics for categorical data generally follow this formula:

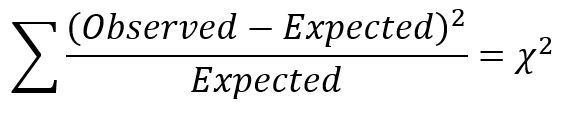
For each of the six cells representing a combination of gender and union status, the number in the cell is the count we observe. “Expected” refers to what we would see in each cell under the null hypothesis. That means if gender and union status are independent (or if union status is homogeneous across the genders).

We calculate the difference, square it, and divide by the expected count for each cell. We then add these all together, and that is the chi-square test statistic.

Where do we get the expected counts for each cell?

Let’s examine the combination of male and union member under independence. If gender and union membership are independent, then how many male union members do we expect? Well,
– 10.81% of the sample are union members
– 51.96% are male

So, if they are independent, 10.81% x 51.96% is 5.62%, and 5.62% of 1,322 is 74.3. This is how many individuals we would expect to be male union members.

Now let’s consider male union members under homogeneity. Overall, 10.81% of the sample are union members. If this is the same for both males and females, then of the 687 males, we expect 74.3 to be union members.

Independence and homogeneity result in the same expected number of union members! It turns out this calculation is the same for every cell in the table. It follows that the chi-square statistic is also the same.

Does It Matter?

As it turns out, independence and homogeneity are two sides of the same coin. If gender and union status are independent, then union status is distributed the same way for males and females.

So which test should you say you are using, if they turn out the same?

Again, that comes back to how you have phrased your research question. Are you determining whether gender and union status are related. That is a test of independence. Are you looking for differences between males and females? That is a test of homogeneity.

Tagged With: chi-square test, homogeneity, independence

Related Posts

  • What is a Chi-Square Test?
  • Member Training: Seven Fundamental Tests for Categorical Data
  • Six Easy Ways to Complicate Your Analysis
  • Effect Size Statistics: How to Calculate the Odds Ratio from a Chi-Square Cross-tabulation Table

What is a Chi-Square Test?

by Karen Grace-Martin  Leave a Comment

Just about everyone who does any data analysis has used a chi-square test. Probably because there are quite a few of them, and they’re all useful.

But it gets confusing because very often you’ll just hear them called “Chi-Square test” without their full, formal name. And without that context, it’s hard to tell exactly what hypothesis that test is testing. [Read more…] about What is a Chi-Square Test?

Tagged With: chi-square test, goodness of fit, homogeneity, independence

Related Posts

  • The Difference between Chi Square Tests of Independence and Homogeneity
  • Member Training: Seven Fundamental Tests for Categorical Data
  • Six Easy Ways to Complicate Your Analysis
  • Effect Size Statistics: How to Calculate the Odds Ratio from a Chi-Square Cross-tabulation Table

Member Training: Seven Fundamental Tests for Categorical Data

by TAF Support 

In the world of statistical analyses, there are many tests and methods that for categorical data. Many become extremely complex, especially as the number of variables increases. But sometimes we need an analysis for only one or two categorical variables at a time. When that is the case, one of these seven fundamental tests may come in handy.

These tests apply to nominal data (categories with no order to them) and a few can apply to other types of data as well. They allow us to test for goodness of fit, independence, or homogeneity—and yes, we will discuss the difference! Whether these tests are new to you, or you need a good refresher, this training will help you understand how they work and when each is appropriate to use.

[Read more…] about Member Training: Seven Fundamental Tests for Categorical Data

Tagged With: categorical outcome, categorical variable, chi-square test, cochran-mantel-haenszel, fisher exact test, goodness of fit, independence, mcnemar test, Z test

Related Posts

  • What is a Chi-Square Test?
  • The Difference between Chi Square Tests of Independence and Homogeneity
  • Chi-Square Test of Independence Rule of Thumb: n > 5
  • Member Training: Multinomial Logistic Regression

The Proportional Hazard Assumption in Cox Regression

by guest contributer  2 Comments

by Steve Simon, PhD

The Cox regression model has a fairly minimal set of assumptions, but how do you check those assumptions and what happens if those assumptions are not satisfied?

Non-proportional hazards

The proportional hazards assumption is so important to Cox regression that we often include it in the name (the Cox proportional hazards model). What it essentially means is that the ratio of the hazards for any two individuals is constant over time. They’re proportional. It involves logarithms and it’s a strange concept, so in this article, we’re going to show you how to tell if you don’t have it.

There are several graphical methods for spotting this violation, but the simplest is an examination of the Kaplan-Meier curves.

If the curves cross, as shown below, then you have a problem.

Likewise, if one curve levels off while the other drops to zero, you have a problem.

Figure 2. Kaplan-Meier curve with only one curve leveling off

You can think of non-proportional hazards as an interaction of your independent variable with time. It means that you have to do more work in interpreting your model. If you ignore this problem, you may also experience a serious loss in power.

If you have evidence of non-proportional hazards, don’t despair. There are several fairly simple modifications to the Cox regression model that will work for you.

Nonlinear covariate relationships

The Cox model assumes that each variable makes a linear contribution to the model, but sometimes the relationship may be more complex.

You can diagnose this problem graphically using residual plots. The residual in a Cox regression model is not as simple to compute as the residual in linear regression, but you look for the same sort of pattern as in linear regression.

If you have a nonlinear relationship, you have several options that parallel your choices in a linear regression model.

Lack of independence

Lack of independence is not something that you have to wait to diagnose until your data is collected. Often it is something you are aware from the start because certain features of the design, such as centers in a multi-center study, are likely to produce correlated outcomes. These are the same issues that hound you with a linear regression model in a multi-center study.

There are several ways to account for lack of independence, but this is one problem you don’t want to ignore. An invalid model will ruin all your confidence intervals and p-values.

Tagged With: Cox Regression, curves, hazards, independence, Kaplan-Meier curve, model, multi-center study, nonlinear, proportional, residual plot

Related Posts

  • What Is a Hazard Function in Survival Analysis?
  • Six Types of Survival Analysis and Challenges in Learning Them
  • Member Training: An Introduction to Kaplan-Meier Curves
  • Interpreting the Shapes of Hazard Functions in Survival Analysis

Primary Sidebar

This Month’s Statistically Speaking Live Training

  • Member Training: Moderated Mediation, Not Mediated Moderation

Upcoming Workshops

    No Events

Upcoming Free Webinars

TBA

Quick links

Our Programs Statistical Resources Blog/News About Contact Log in

Contact

Upcoming

Free Webinars Membership Trainings Workshops

Privacy Policy

Search

Copyright © 2008–2023 The Analysis Factor, LLC.
All rights reserved.

The Analysis Factor uses cookies to ensure that we give you the best experience of our website. If you continue we assume that you consent to receive cookies on all websites from The Analysis Factor.
Continue Privacy Policy
Privacy & Cookies Policy

Privacy Overview

This website uses cookies to improve your experience while you navigate through the website. Out of these, the cookies that are categorized as necessary are stored on your browser as they are essential for the working of basic functionalities of the website. We also use third-party cookies that help us analyze and understand how you use this website. These cookies will be stored in your browser only with your consent. You also have the option to opt-out of these cookies. But opting out of some of these cookies may affect your browsing experience.
Necessary
Always Enabled
Necessary cookies are absolutely essential for the website to function properly. This category only includes cookies that ensures basic functionalities and security features of the website. These cookies do not store any personal information.
Non-necessary
Any cookies that may not be particularly necessary for the website to function and is used specifically to collect user personal data via analytics, ads, other embedded contents are termed as non-necessary cookies. It is mandatory to procure user consent prior to running these cookies on your website.
SAVE & ACCEPT