Lest you believe that odds ratios are merely the domain of logistic regression, I’m here to tell you it’s not true.
One of the simplest ways to calculate an odds ratio is from a cross tabulation table.
We usually analyze these tables with a categorical statistical test. There are a few options, depending on the sample size and the design, but common ones are Chi-Square test of independence or homogeneity, or a Fisher’s exact test.
And while that test gives you a p-value, it doesn’t give you a good effect size statistic.
Along with association statistics, like phi, an odds ratio is a good standardized effect size statistic for a table like this.
For example, here is a simple data set with the cross-tabulation between two binary variables: Whether or not someone runs more than 25 km/week and whether or not they experienced joint pain.
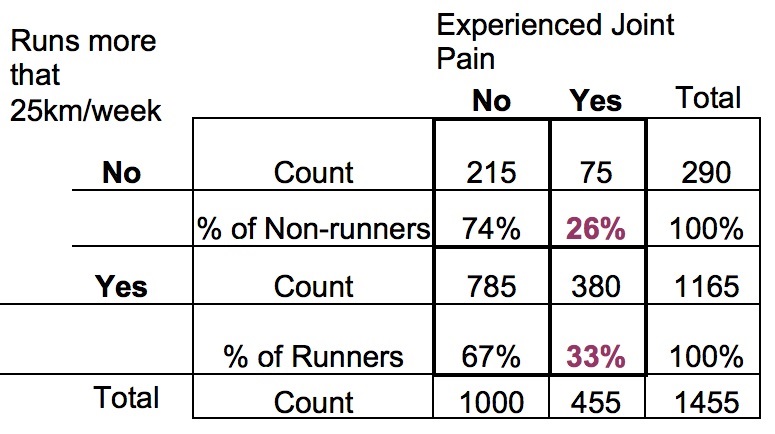
It’s a pretty large sample. How do we get the odds ratio?
How to Calculate the Odds Ratio
We will come back to how to interpret it, but first let’s talk about how to calculate the odds ratio.
There are different possible odds ratios we could get out of this table, but I’m going to choose the one that makes the most sense to me from a research perspective: the odds-ratio for runners experiencing joint pain compared to non-runners.
We start by calculating two odds: the odds of experiencing joint pain for Runners and the odds of experiencing joint pain for Non-runners. (Yes, I’m calling people who run 24 km/week non-runners. No offense intended. I need a simple name for the groups).
The odds that a runner has joint pain:
The odds that a Runner has joint pain is based on its probability. We estimate that by the percentage of non-runners who experience joint pain. 33%
Now a true probability is on a 0 to 1 scale, not the 0 to 100 scale that a percentage is. So first we divide that by 100 to get .33.
Let’s call that Prunners: the probability that a Runner has joint pain.
Now that we have the probability of joint pain for Runners, we can calculate the odds of joint pain for Runners. The odds of joint pain for Runners is the probability of joint pain divided by the probability of not joint pain.
This looks like: P/(1-P). In this case, it’s .33/.67 = .49.
We say it like: the odds of a runner having joint pain is .49 to 1.
We interpret it like: for every 49 runners who have joint pain, 100 don’t. I had to switch to 49 and 100 because it doesn’t make sense to say “for every .49 runners who have joint pain, 1 doesn’t.” Or “for every 4.9 runners who have joint pain, 10 don’t”. But those are both technically accurate, because it’s really about expressing the ratio.
Yup. That’s right, the odds is itself a ratio. But that is not the odds ratio we’re trying to compute. That’s just the odds.
I know. Super confusing that the odds, which is a ratio of two probabilities, isn’t the odds ratio we’re after. But it’s true.
The odds ratio we’re after is actually a ratio of two odds. So we need to compute another one.
The odds that a non-runner has joint pain:
Let’s call that Pnon-runners: the probability that a Non-Runner has joint pain.
We calculate it the exact same way, but now we use the numbers from the Non-Runners’ row of data.
P/(1-P) = .26/.74=.35
Or we could say: for every 35 Non-Runners who have joint pain, 100 don’t.
You can see it’s smaller than the odds for Runners, which was .49.
The Odds Ratio
Now that we have both odds, we can calculate the Odds Ratio. It is the ratio of these two odds: Oddsrunners/Oddsnon-runners.
OR = .49/.35 = 1.4
So the odds ratio of a Runner developing joint pain compared to a Non-Runner is 1.4.
What does the Odds Ratio mean?
One way to say it is that the odds of a Runner developing joint pain is 1.4 times that of a Non-Runner developing joint pain. It’s more likely.
It’s often easier to think of a ratio, though, as a percentage. 1.4 times as much is the same as 40% higher. So the easiest way to think about it is the odds* of joint pain is about 40% higher for runners than for non-runners.
I realize it’s still a little hard to think in odds instead of probabilities, since that’s what most of us are used to. But if you unpack it a bit, you can train yourself to think of it this way.
Both those odds: 49:100 for Runners and 35:100 for Non-Runners are comparisons to 100 people without joint pain.
So in comparison to every 100 people in that group without pain, the Runner’s group has 40% more in pain.
*Notice I specifically used the word “odds” in that sentence and not “likely.” I’ve found that if you use the term “likely” most people will interpret that as meaning a 40% higher probability. So while it’s not technically inaccurate, it can be unintentionally misleading.

Leave a Reply