It’s easy to make things complex without meaning to. Especially in statistical analysis.
Sometimes that complexity is unavoidable. You have ethical and practical constraints on your study design and variable measurement. Or the data just don’t behave as you expected. Or the only research question of interest is one that demands many variables.
But sometimes it isn’t. Seemingly innocuous decisions lead to complicated analyses. These decisions occur early in the design, research questions, or variable choice.
If you’re prepared to do complex analyses, you’re in great shape. If you have the time and background to learn, great. Or if you have the resources to get help, no problem.
But if you have tight deadlines, no resources to hire someone to run things for you, no one to guide you, and there is a large gap between your current skills and what you’ll need for your complex analysis? You really want to keep things simple where you can.
Necessary or not, here are a few (of many) easy ways to make your analysis more complex. The more of these you include, the more complex your analysis will be.
Ways to make your analysis more complex
1. Add covariates
One of the great advantages of a regression model is its ability to include covariates. These are predictor variables whose effects you can adjust for.
But if you really need things simple and you don’t really need to include them, keep them out. The simplest statistical tests don’t accommodate covariates. They have one independent and one dependent variable. No more.
Include even one covariate and you have to use some sort of regression model. There is a lot more complexity to these models, compared to tests with a single independent variable.
2. Add interactions
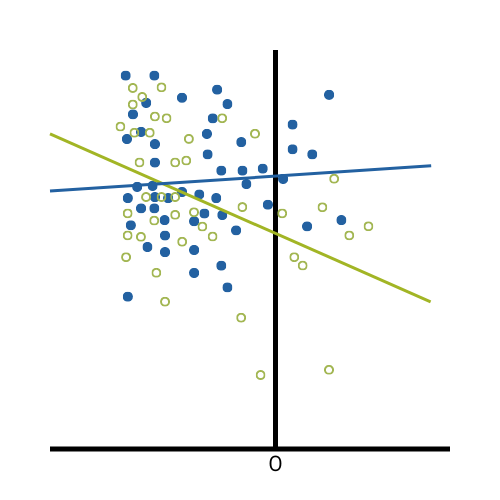 Interactions allow you to test hypotheses that cannot be tested any other way. They’re extremely useful.
But interactions do the same thing that covariates do — require a model instead of a simple test.
Interaction effects are even harder to understand and communicate, so only include them if you need them.
3. Use an outcome variable that is not continuous, unbounded, and numerical
 There is a reason that the first regression model you learn is a linear regression model. It’s the simplest regression model. It forms the backbone of Stage 2 statistical skill. All other regression models are at Stage 3.
But not all outcome variables work for linear regression. It has an important assumption of normally distributed error terms, and you’ll rarely, if ever, meet that assumption if the outcome variable is categorical, ordinal, bounded, or discrete.
The good news is there are many other models that work for these outcome variables. The bad news: they’re more complicated.
4. Add blocking or other restrictions on randomization
Matching, pairing, counterbalancing, blocking, and a host of other design elements all need to be accounted for in the analysis.
Yes, they have advantages. Stop and consider whether the advantages outweigh the complications to the analysis.
5. Use scales instead of single variables
Many important variables cannot be directly measured with a single variable. But could a single variable work as a reliable and valid proxy?
Any time you combine variables into an scale, you can’t just use the scale without first establishing reliability and validity. This is an onerous process and requires different samples than the one you’re using in your analysis. If you’re using a well-established and previously tested scale, it’ll be simpler than if you create your own.
6. Add repeated measures
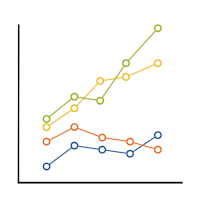 There are great reasons to use repeated measures. They allow tests of research questions about change or growth. They reduce standard errors, shrinking confidence intervals and increasing power.
But they also add complexity. Repeated measures acts a bit like a multiplier. If you can keep everything else simple — no covariates, no other restrictions on randomization, normally distributed outcomes — then there are still simple tests for pre/post designs. But add it to any other complications and the complexity is magnified.
How to keep an analysis simple
One of the early steps of data analysis is writing a data analysis plan. The choice of analysis brings together the research question, the design, the types of variables, and potential data issues you are likely to encounter.
The more you plan ahead, the better equipped you will be to avoid unnecessary complications. There will be enough complications you can’t avoid.
But think long and hard about whether each of those six complications listed above is necessary. If it’s not, and you’re not in a place to uplevel your skills or hire help, do what you can to keep it simple.
Get trusted feedback on your plan if you’re not sure about it. It’s a lot easier to redo the plan than the analysis.
Leave a Reply