Whenever you use a multi-item scale to measure a construct, a key step is to create a score for each subject in the data set.
This score is an estimate of the value of the latent construct (factor) the scale is measuring for each subject. In fact, calculating this score is the final step of running a Confirmatory Factor Analysis.
The simplest way to create a score is to add up (or average) the values of each variable on the scale (indicator) for each subject. This is called a factor-based score. It’s based on the factor in the factor analysis, but is not technically a factor score since it doesn’t use the factor weights.
Is this an acceptable method? The chances of this being acceptable is between slim and none, and Slim left town.
Why is adding values on the scale not a good idea?
A true factor score is the best estimate of the subject’s value on the latent construct you’re measuring with your observed indicator variables. The factor loadings, as calculated by the analysis, determines the optimal weighting for each indicator.
When the EFA/CFA and structural equation models “predict” the factor scores it uses a linear regression, incorporating the factor loadings into the model.
To compare the difference between the “add up the scores” and linear regression approach we will use an example. In this example, five indicators together model the latent construct of Assertiveness:
AS3 Automatically take charge
AS4 Know how to convince others
AS5 Am the first to act
AS6 Take control of things
AS7 Wait for others to lead the way
The table below gives the coefficients generated by the linear regression approach. For the addition method the mean of the linear regression coefficients was used to evenly weight the variables.
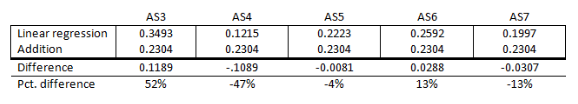
The two approaches will not generate similar scores.
AS3’s weighting is 52% greater and AS4 is -47% less using linear regression compared to addition.
There is one situation where it makes sense to use addition. If the factor loadings are all equal, we can add up the scores for each indicator to generate the factor scores. But we cannot assume they are equal without testing them.
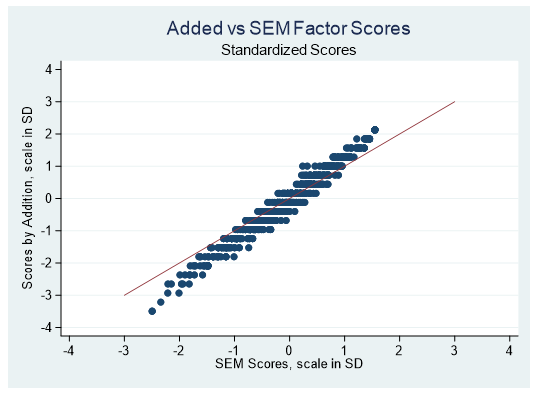
Let’s visually compare the factor scores generated by a structural equation model and adding the indicator scores together. The factor scores generated by the structural equation model are standardized, with a mean of zero and a standard deviation of 1. To compare the addition approach scores we will standardize them as well.
Below is a scatterplot of the SEM and addition generated scores. The diagonal line represents the line where the scores generated by the two methods are equal.
There are very few points on the diagonal line. The generated scores are not the same.
There are many situations in statistics where the best approach isn’t clear. This isn’t one of them. Running a confirmatory factor analysis and computing accurate scores is important for getting accurate measurements.

I shared this post with a colleague who has written at least one book & several articles on measurement scales. He thought the example looked a bit fishy, possibly because AS7 had not been reverse-coded.
Hi Bruce,
There is nothing fishy here. AS7 was reversed coded behind the scenes before the calculation was done. Your colleague, who has written on the subject, would agree that adding up the scores for each indicator is not the proper method for generating factor scores.
Hello, and thank you. Information on this part of model specification has been next to impossible to find. I have been searching for months, on the web, books, asking statistics professors, tutors, anyone who has had some experience with SEM, and no where have I found this information until now. I cannot express how thrilled I am. Thank you. This is the first discussion I have come across beyond the use of parcels. This also gave me langage to use, i.g., factor score, when discussing indicators. And it certainly has clarified the differences between parcels and factors, and why parcels are hazardous to reliable research. However, it leaves me wondering one important part: How do I generate a factor score I can use as an indicator for latent variables in SEM?
Hi Karen. Thank you for this great explanation . As a statistician working in the middle eastern countries people are accustomed to item parcels . I struggle each time convincing people that factor based scores are often better approximation of the latent factor than item parcels when done appropriately . I found across time that factor-based ( factor weighted) scores are also good enough for some situations . People confuse congeneric with parallel models and tau-equivalent model based scales assuming them all equal when in reality they are different scale engineering/s, and that is where item parcels do Not fit all when used for the wrong scale as a universal skew-driver .
I’ve been assigned a household (HH) living standards project in 10 districts of Punjab, Pakistan. The brief states that five HH classification scales should be considered: (1) eight conventional Pakistani HH income categories, (2) seven socio-occupational categories (recommended by ESOMAR), (3) major earner’s current source of income, (4) socio-economic category of HH residence (e.g, bungalow, high-rise flats, etc), (5) quantitative description of HH residence (e.g., no of rooms, no of washrooms, where kitchen located, etc).
The objective of the project is to guide federal govt policy by attempting a measure joining a selection of the two or three classification scales that most-closely associate with and predict a HH’s living standard out of four required living standard measures, namely, no. & ages of school-going children, HH health measures, HH female educational levels & occupations, transport vehicle ownership & availability.
Since our team is unable to identify the most appropriate statistical analysis approach (discussion revolve around conjoint analysis, logistic regression, generalised linear models, multiple discriminant analysis, etc) I believe we have successfully confused the issue. Could you guide at this early stage?
The Households Socioeconomic state (ses) is multidimensional and can be characterized with categorical factor analysis ( a form of non-linear factor analysis) and / structural equation modelling methods . Someone can argue that poverty , low economic and educational as well as social factor are indeed multi-faceted and multidimensional as such targetting your data with non-rotated factor analysis with catpca first can unveil latent factor from mixed ( continuous and categorical and even nominal indicators) . After obtaining the transformed indicators you can target them with rotated factor analysis to summarize them into one socioeconomic indexes . usually the analysis yields 1-3 factors, you take the first one if the analysis was reliable and explained more 40% of the variations on peoples indicators of poverty . Much evidence in support of non-linear factor analysis for ses estimation .