You’ll be excited to hear we’re doing another Statistics Skills Accelerator for our Statistically Speaking members: Count Models.
Stats Skills Accelerators are structured events focused on an important topic. They feature Stat’s Amore Trainings in a suggested order, as well as  live Q&As specific to the Accelerator.
In August, our mentors will be running a new Accelerator. The first Q&A is August 6, 2025 at 3 pm ET, hosted by Jeff Meyer.
Count models are used when the outcome variable in a model or group comparison is a discrete count:
- Number of eggs in a clutch
- Number of days in intensive care
- Number of aggressive incidents in detention
Count models come in a few types, and any of these can also be used for rates:
- Poisson Regression is the simplest and is the basis for all the other models, but its assumptions are rarely met with real data.
- Negative Binomial regression adds an extra parameter to a Poisson regression measure the extra variance that often occurs in real data.
- Truncated count models work when the lowest values (often just zero) cannot occur. This happens when a count has to occur in order to be part of the population of interest.
- Zero inflated count models are used when there are more zeros than expected. For this model, some zeros could have been something else and others couldn’t.
- Hurdle models also work when there are more zeros than expected, but the process of having a zero is different. In these models, there is an actual “hurdle” one has to pass in order to have a non-zero count.
- Logistic regression, when your count is out of of maximum number.
In this accelerator, learn about the different types of count models, how to understand their results, how to apply them to rates, and how to choose among them.
Note: This training is an exclusive benefit to members of the Statistically Speaking Membership Program and is a combination of watching recorded trainings and live events.
(more…)
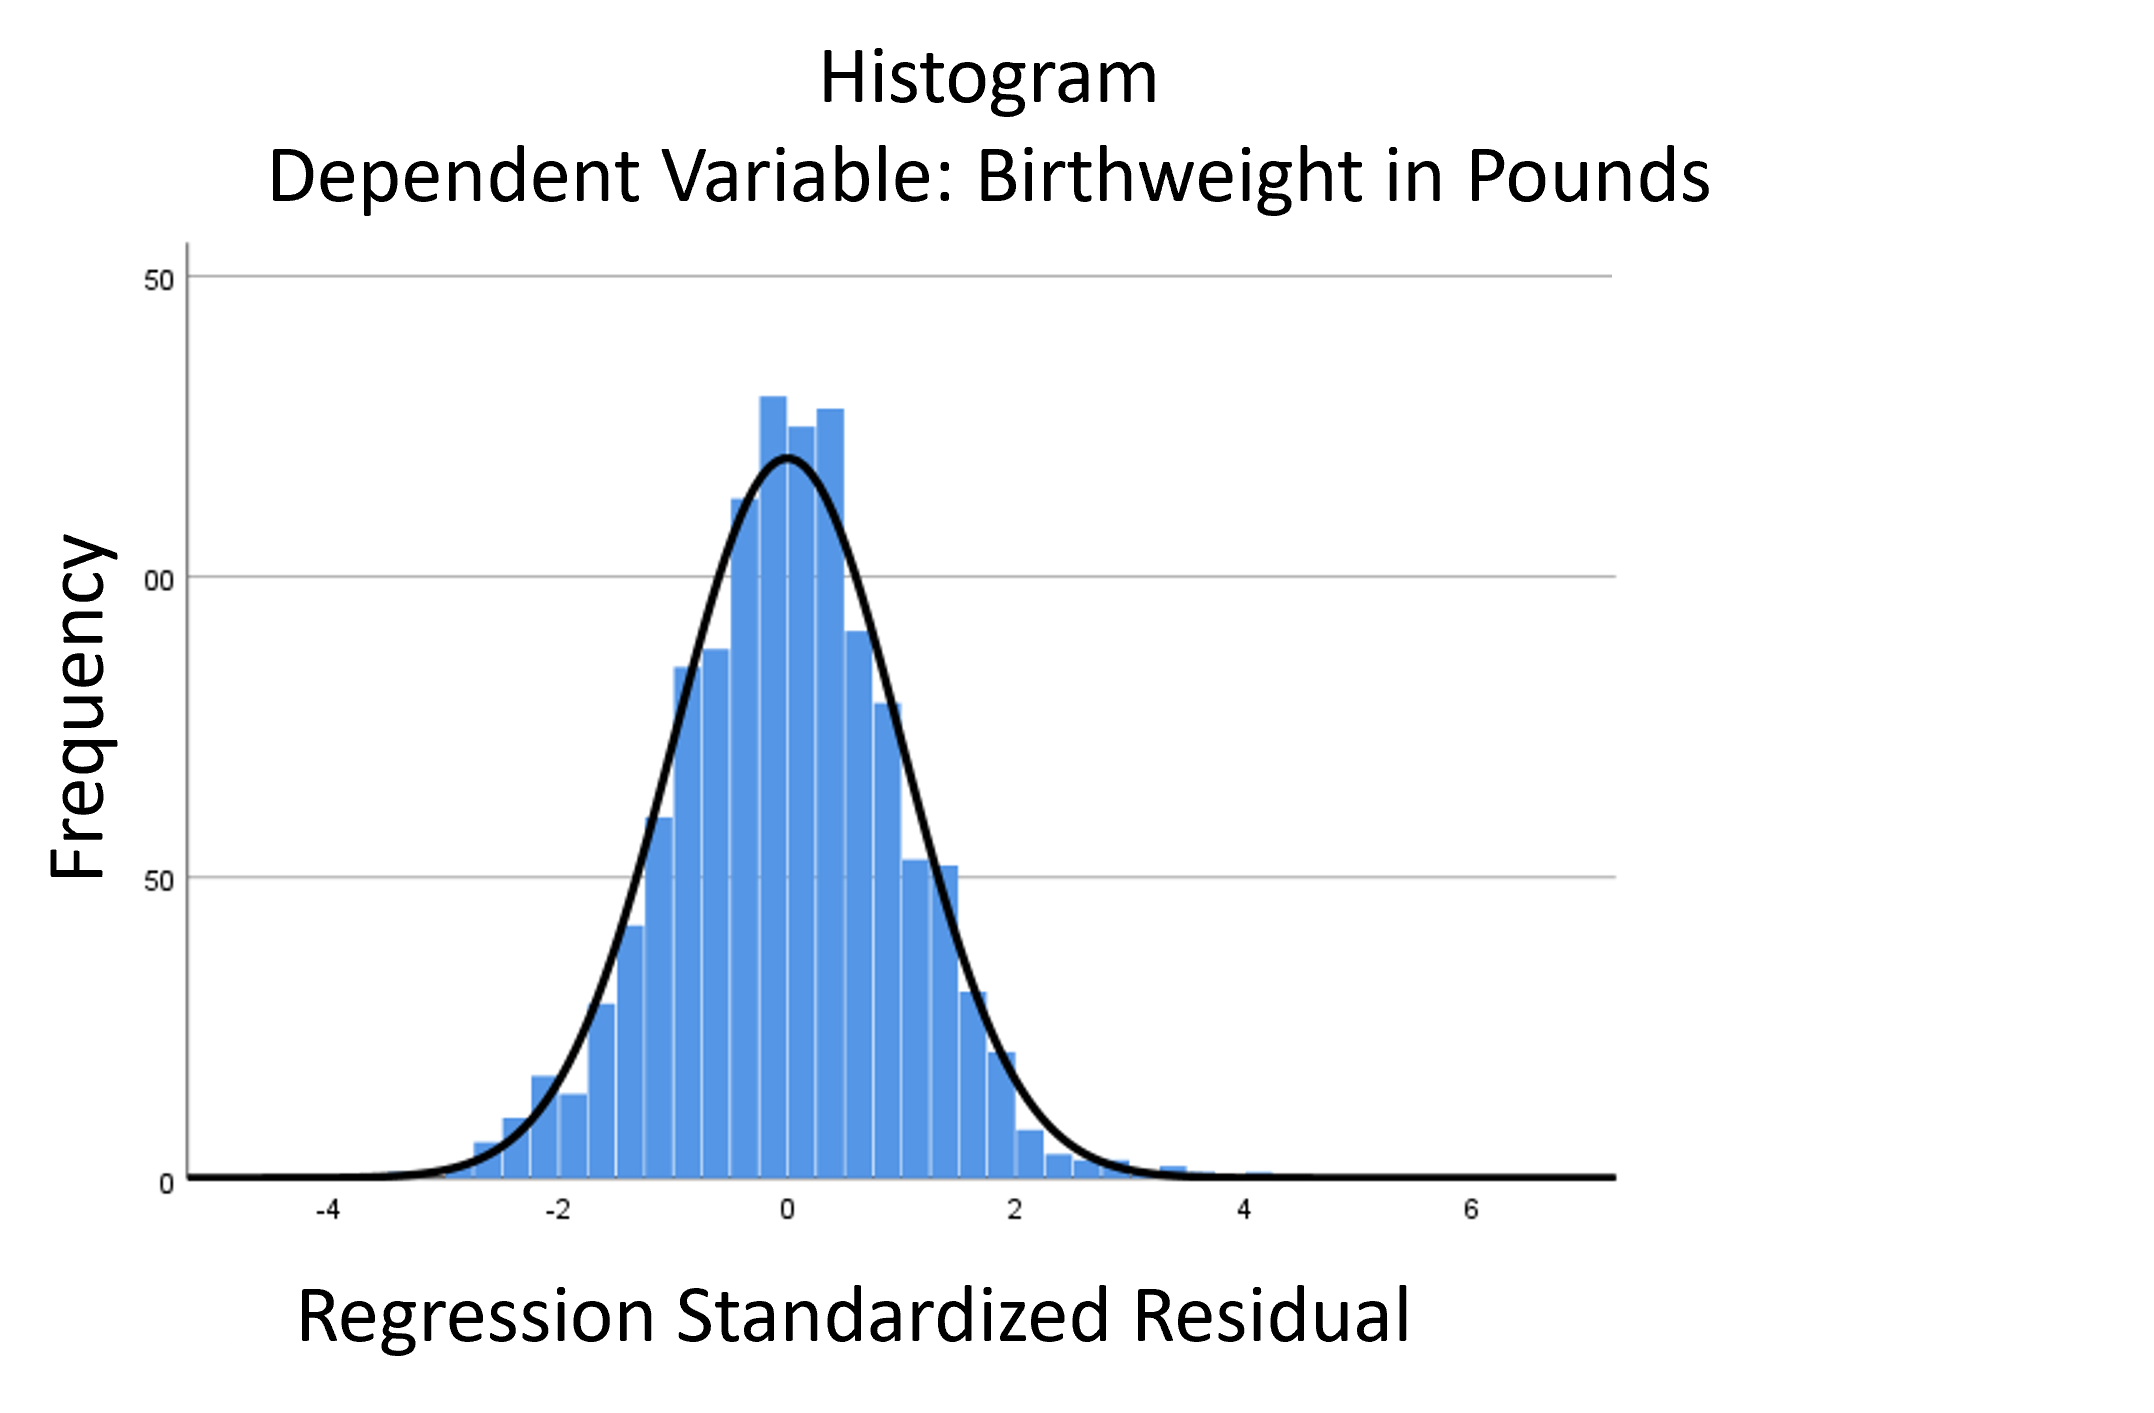
The linear model normality assumption, along with constant variance assumption, is quite robust to departures. That means that even if the  assumptions aren’t met perfectly, the resulting p-values and confidence intervals will still be reasonable estimates.
This is great because it gives you a bit of leeway to run linear models, which are intuitive and (relatively) straightforward. This is true for both linear regression and ANOVA.
You do need to check the assumptions anyway, though. You can’t just claim robustness and not check. Why? Because some departures are so far off that the p-values and confidence intervals become inaccurate. And in many cases there are remedial measures you can take to turn non-normal residuals into normal ones.
But sometimes you can’t.
Sometimes it’s because the dependent variable just isn’t appropriate for a linear model. The (more…)
When your dependent variable is not continuous, unbounded, and measured on  an interval or ratio scale, linear models don’t fit. The data just will not meet the assumptions of linear models. But there’s good news, other models exist for many types of dependent variables.
Today I’m going to go into more detail about 6 common types of dependent variables that are either discrete, bounded, or measured on a nominal or ordinal scale and the tests that work for them instead. Some are all of these.
(more…)
A common situation with count outcome variables is there are a lot of zero values. The Poisson distribution used for modeling count variables takes into account that zeros are often the most

common value, but sometimes there are even more zeros than the Poisson distribution can account for.
This can happen in continuous variables as well–most of the distribution follows a beautiful normal distribution, except for the big stack of zeros.
This webinar will explore two ways of modeling zero-inflated data: the Zero Inflated model and the Hurdle model. Both assume there are two different processes: one that affects the probability of a zero and one that affects the actual values, and both allow different sets of predictors for each process.
We’ll explore these models as well as some related models, like Zero-One Inflated Beta models for proportion data.
Note: This training is an exclusive benefit to members of the Statistically Speaking Membership Program and part of the Stat’s Amore Trainings Series. Each Stat’s Amore Training is approximately 90 minutes long.
(more…)
Like the chicken and the egg, there’s a question about which comes first: run a model or check assumptions? Unlike the chicken’s, the model’s question has an easy answer.
There are two types of model assumptions in a statistical model. Some are distributional assumptions about the errors. Examples include independence, normality, and constant variance in a linear model.
 Others are about the form of the model. They include linearity and (more…)
Count variables are common dependent variables in many fields. For example:
- Number of diseased trees
- Number of salamander eggs that hatch
- Number of crimes committed in a neighborhood
Although they are numerical and look like they should work in linear models, they often don’t.
Not only are they discrete instead of continuous (you can’t have 7.2 eggs hatching!), they can’t go below 0. And since 0 is often the most common value, they’re often highly skewed — so skewed, in fact, that transformations don’t work.
There are, however, generalized linear models that work well for count data. They take into account the specific issues inherent in count data. They should be accessible to anyone who is familiar with linear or logistic regression.
In this webinar, we’ll discuss the different model options for count data, including how to figure out which one works best. We’ll go into detail about how the models are set up, some key statistics, and how to interpret parameter estimates.
Note: This training is an exclusive benefit to members of the Statistically Speaking Membership Program and part of the Stat’s Amore Trainings Series. Each Stat’s Amore Training is approximately 90 minutes long.
About the Instructor

Karen Grace-Martin helps statistics practitioners gain an intuitive understanding of how statistics is applied to real data in research studies.
She has guided and trained researchers through their statistical analysis for over 15 years as a statistical consultant at Cornell University and through The Analysis Factor. She has master’s degrees in both applied statistics and social psychology and is an expert in SPSS and SAS.
Not a Member Yet?
It’s never too early to set yourself up for successful analysis with support and training from expert statisticians.
Just head over and sign up for Statistically Speaking.
You'll get access to this training webinar, 130+ other stats trainings, a pathway to work through the trainings that you need — plus the expert guidance you need to build statistical skill with live Q&A sessions and an ask-a-mentor forum.