Like the chicken and the egg, there’s a question about which comes first: run a model or check assumptions? Unlike the chicken’s, the model’s question has an easy answer.
There are two types of model assumptions in a statistical model. Some are distributional assumptions about the errors. Examples include independence, normality, and constant variance in a linear model.
 Others are about the form of the model. They include linearity and including the right predictors.
You can get clues about whether most of these assumptions will be met before running a model. But you can’t check them.
All the distributional assumptions of linear models are about the errors. And to check those, you need their sample estimates: residuals. Many of the others can also be checked by looking at residuals.
And you can’t get residuals until you run a model.
Likewise, for generalized linear models, the distributional assumptions are for Y|X. Again, we need to run the model first to get those.
(For the record, the advice for checking assumptions first does apply for univariate or bivariate tests, like t-tests and correlations. It works there because the distributional assumptions apply to the data you already have.
It just doesn’t work for models.)
In the steps to running a model I use, testing assumptions is step 11. Running an initial model is number 9. Here is the full list, in case you haven’t seen it.
- Write out research questions in theoretical and operational terms
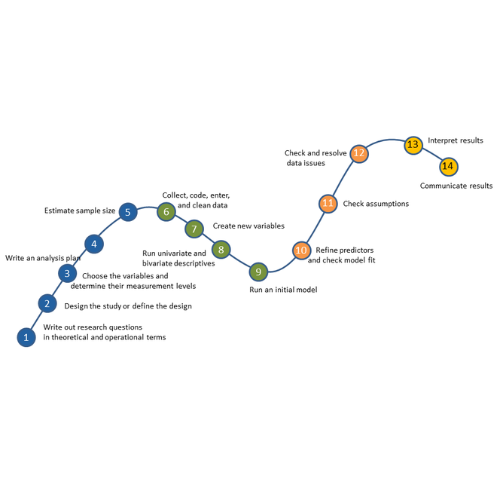
- Design the study or define the design
- Choose the variables for answering the research questions and determine their level of measurement
- Write an analysis plan
- Calculate sample size estimations
- Collect, code, enter, and clean data
- Create new variables
- Run univariate and bivariate statistics
- Run an initial model
- Refine predictors and check model fit
- Test assumptions
- Check for and resolve data issues
- Interpret Results
- Communicate Results
A Big Fat Caveat
So don’t start running normal probability plots or checking variances before you are reasonably sure you have what is close to a final model.
But that doesn’t mean you should put a lot of work into model refinement without a reasonable idea of whether the model is appropriate for the data.
You want to be thinking about the most appropriate type and form of model from the very beginning.
If you’ve done the foundational work in the early steps, testing assumptions is about looking for minor deviations, not major transgressions.
The Design
In Step 2, you defined the design. You checked for things like repeated measures, pairing, cluster sampling, or nested factors. Any of these would make errors non-independent.
If any of these design issues exist in your data, you’re not going to apply a linear model and only notice non-independence once you get to the 11th step.
Instead, you’d choose a model that accounts for the non-independence.
So yes, you still should check if the non-independence exists in the data during step 11. (Sometimes it doesn’t even though the design indicates it’s likely). But you should look for it and incorporate it into the analysis plan much, much earlier.
The Scales of Measurement
In Step 3, you defined the measurement scales of all variables.
Remember, an outcome variable (Y) does not have to be normally distributed for a linear model’s assumptions to be met.
The errors do.
So don’t bother running tests of normality on Y. All that will do is make you panic unnecessarily if it’s a bit skewed. (But do look at the distribution in an upcoming step, before you run a single model).
Since the predictor variables (the Xs) affect the shape of Y|X’s distribution, it’s possible for the errors to be normally distributed even when Y isn’t.
But this can only happen if Y is continuous, unbounded, and measued on an interval or ratio scale.
If any of these fail, it’s nearly impossible to get normally distributed residuals, even with remedial transformations.
Types of variables that will generally fail these criteria include:
- Categorical Variables, both nominal and ordinal.
- Count Variables, which are often distributed as Poisson or Negative Binomial.
So if you find your outcome variable isn’t continuous, run a more appropriate initial model.
Run descriptive statistics first.
Likewise, in Step 8, you ran univariate and bivariate descriptive statistics—and even better, graphs—on all variables you planned to use in your model.
The univariate graphs will illuminate any distributional hiccups on even continuous data. Skew may not be a problem, especially if it’s not extreme. But other distributional issues can be. Here you’re looking for issues like:
- Zero Inflated data, which have a huge spike in the distribution at 0. They are common in count variables, but can occur with any distribution.
- Censored or truncated data, which have full information only for some values. The distribution gets cut off for some values, at one or both ends.
- Proportions, bounded at 0 and 1, become problematic if much of the data are close to the bounds.
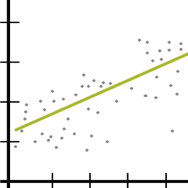
The bivariate graphs will help you see any non-linearity in relationships and give you inklings of non-constant variance. This will allow you to incorporate these issues into the initial model run in Step 9, before you even get to checking assumptions.
When you finally do check the assumptions, you may still have some surprises. But they will be the kind you can remedy, not the kind that forces you to start over.

I wrote my thesis on a topic that required extensive modeling, and this is exactly what I needed when I was learning. There are other resources, but this one just connects with me. Five years and I haven’t built a model since (woo academia) but this is making me want to do it again.
It’s good practice when designing a dataset, survey or otherwise, to do a simulation where you run the proposed analysis on synthetic data to flesh out modeling and interpretation issues before it is too late to revise the analysis plan.
Excellent point, Jon!
Brilliant! Tysm
that is good explanation thank,s