A very common question is whether it is legitimate to use Likert scale data in parametric statistical procedures that 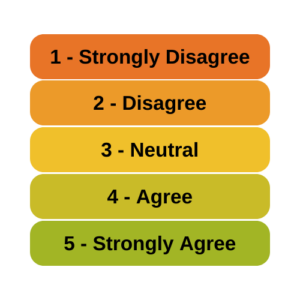 require interval data, such as Linear Regression, ANOVA, and Factor Analysis.
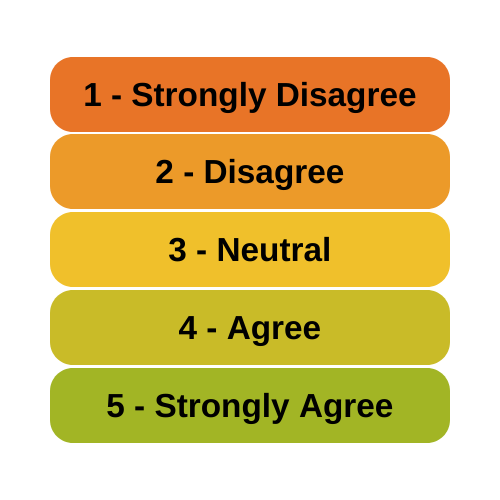
A typical Likert scale item has 5 to 11 points that indicate the degree of something. For example, it could measure agreement with a statement, such as 1=Strongly Disagree to 5=Strongly Agree. It can be a 1 to 5 scale, 0 to 10, etc. (more…)
Like the chicken and the egg, there’s a question about which comes first: run a model or check assumptions? Unlike the chicken’s, the model’s question has an easy answer.
There are two types of model assumptions in a statistical model. Some are distributional assumptions about the errors. Examples include independence, normality, and constant variance in a linear model.
 Others are about the form of the model. They include linearity and (more…)
While there are a number of distributional assumptions in regression models, one distribution that has no assumptions is that of any predictor (i.e. independent) variables.
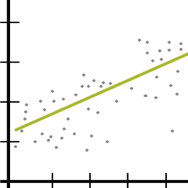
It’s because regression models are directional. In a correlation, there is no direction. Y and X are interchangeable. If you switched them, you’d get the same correlation coefficient.
But regression is inherently a model about the outcome variable, Y. What predicts its value and how well? What is the nature of how predictors relate to it (more…)
Here’s a little reminder for those of you checking assumptions in regression and ANOVA:
The assumptions of normality and homogeneity of variance for linear models are not about Y, the dependent variable. (If you think I’m either stupid, crazy, or just plain nit-picking, read on. This distinction really is important). (more…)
 require interval data, such as Linear Regression, ANOVA, and Factor Analysis.