 I recently received a great question in a comment about whether the assumptions of normality, constant variance, and independence in linear models are about the errors, εi, or the response variable, Yi.
The asker had a situation where Y, the response, was not normally distributed, but the residuals were.
Quick Answer: It’s just the errors.
In fact, if you look at any (good) statistics textbook on linear models, you’ll see below the model, stating the assumptions:
εi ~ i.i.d. N(0, σ²)
That εi is the random error term.
The i.i.d. means every error is independent and identically distributed. They all have the same distribution, which is defined right afterward.
You’ll notice there is nothing similar written about Y.
Let’s dig into this a bit.
What the assumptions of linear models say
There are really three parts to those assumptions. This “~i.i.d. N” abbreviation says a lot in very few letters.
So let’s break this abbreviation apart.
First point, we’re talking about the population here. The errors describe the theoretical distribution of the population of responses above and below the population’s regression line.
Second, we’re saying those errors are independent of each other. That’s the first i in i.i.d.
Third, we’re saying all the errors come from a single normal distribution. That’s the “i.d. N” part. Every error comes from the same normal distribution.
Fourth, which normal distribution? Well, one that has a mean of 0 and a single population variance, which we will call σ².
So so last three points make up our key distributional assumptions about the errors, that:
1. errors are independent of each other
2. errors are normally distributed with a mean of 0
3. errors have constant variance.
But wait. What about Y’s distribution? Doesn’t Y have to be normal?
Really, it doesn’t.
I think this concern comes from a few different similar but not quite the same assumptions in statistics.
Normality in Pearson correlation
One is that for a Pearson correlation coefficient, both Y and X need to be normally distributed.
That’s not true in linear models. For example, it’s totally fine in regression models to have a binary, dummy-coded X. You can’t do that in Pearson correlation. (Or rather, if you do, it turns into a point-biserial correlation, but that’s another story).
But while there are similarities and connections between Pearson correlation and simple linear regression models, they really are distinct.
Partly because linear models have distinct roles between Y and X. Correlations don’t.
And partly because linear models can do a lot more. We can incorporate multiple Xs, interactions, dummy coded categorical predictors. And when we do that, we just need to make sure the errors are normally distributed. Not Y.
Normality in t tests
Another similar but not quite the same assumption is for t-tests and one-way ANOVA. These tests assume that Y is normally distributed within each group. Not Y overall, across all the groups, but within a group. This turns out to be a key distinction.
How can ε be normally distributed if Y isn’t?
Well, ultimately, it’s because Y’s distribution is affected by X.
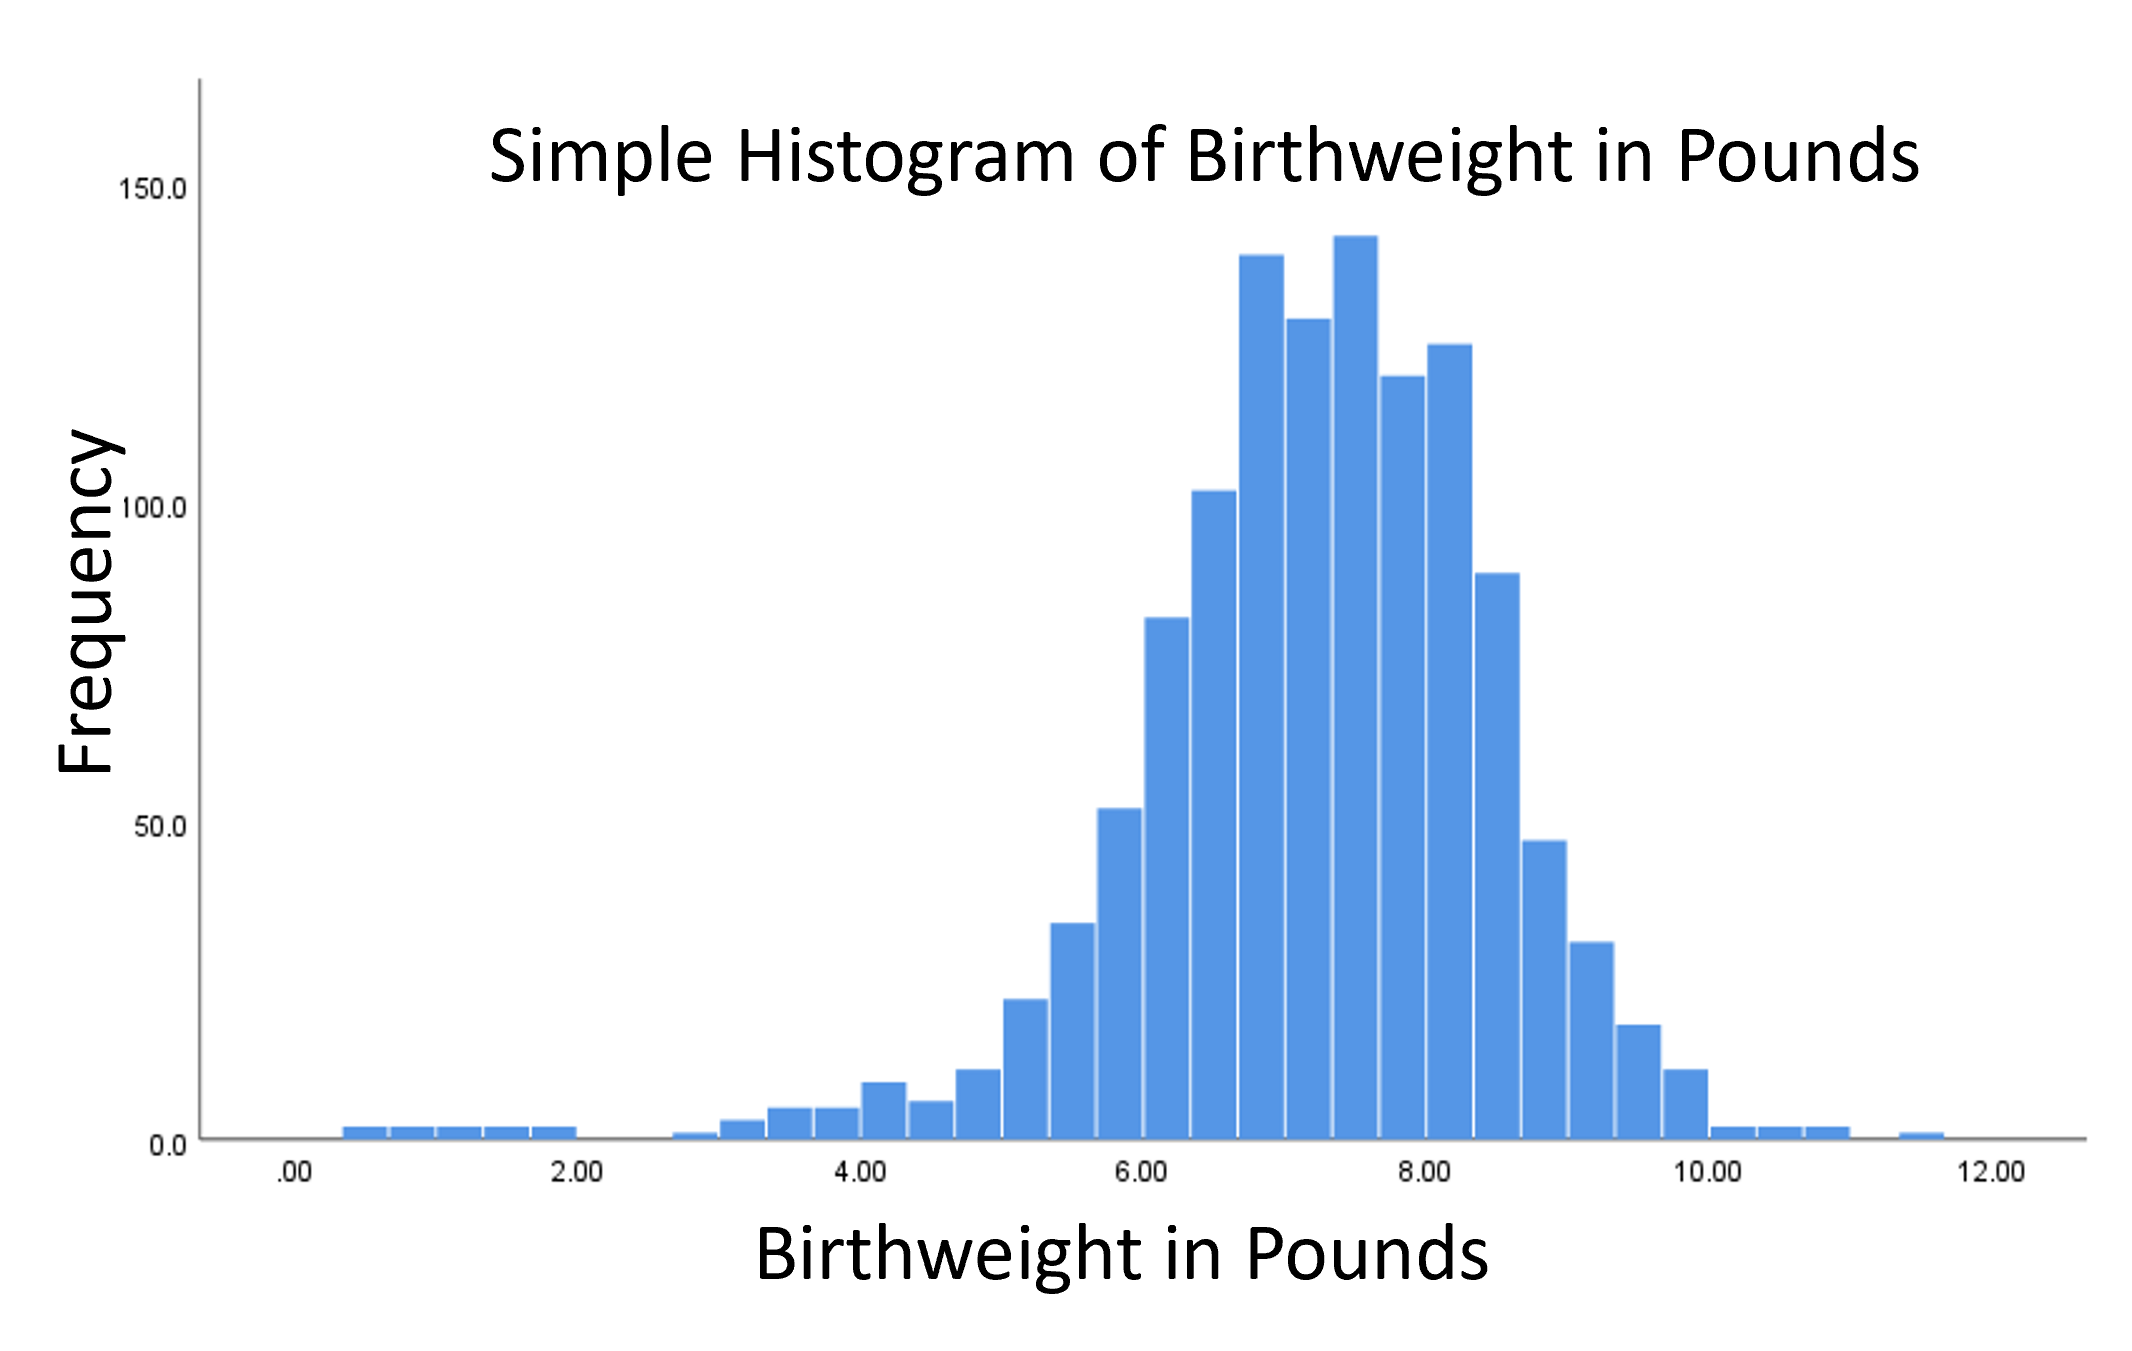
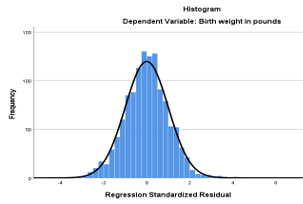
Here’s a great example of a data set where Y is negatively skewed. This is birthweight in pounds, and you can see a clear tail extending to the left, due to a few low birthweight babies.
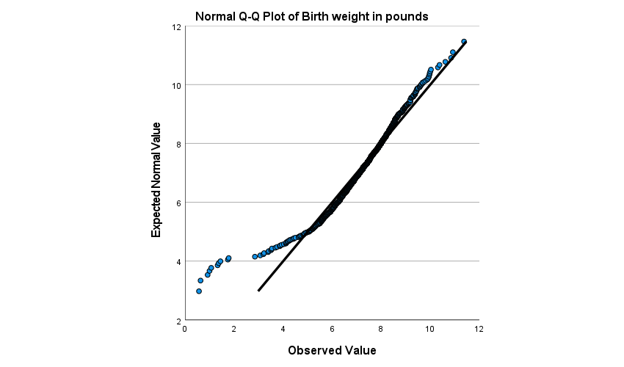
And if you look at it’s Normal QQ plot, you can really see those outliers on the low end.
But if we regress Birthweight in pounds, Y, on Weeks of Gestation, X, the errors don’t have that skew.
Yi = β0 +β1Gestation1i + εi
In other words, once we account for the fact that birthweight is related to weeks of gestation, we no longer have that long tail. There is a long tail in Y overall, but not in the distribution of points around the regression line.
Those low birthweight babies are univariate outliers, but not bivariate outliers. This is the beautiful normal distribution of the errors:
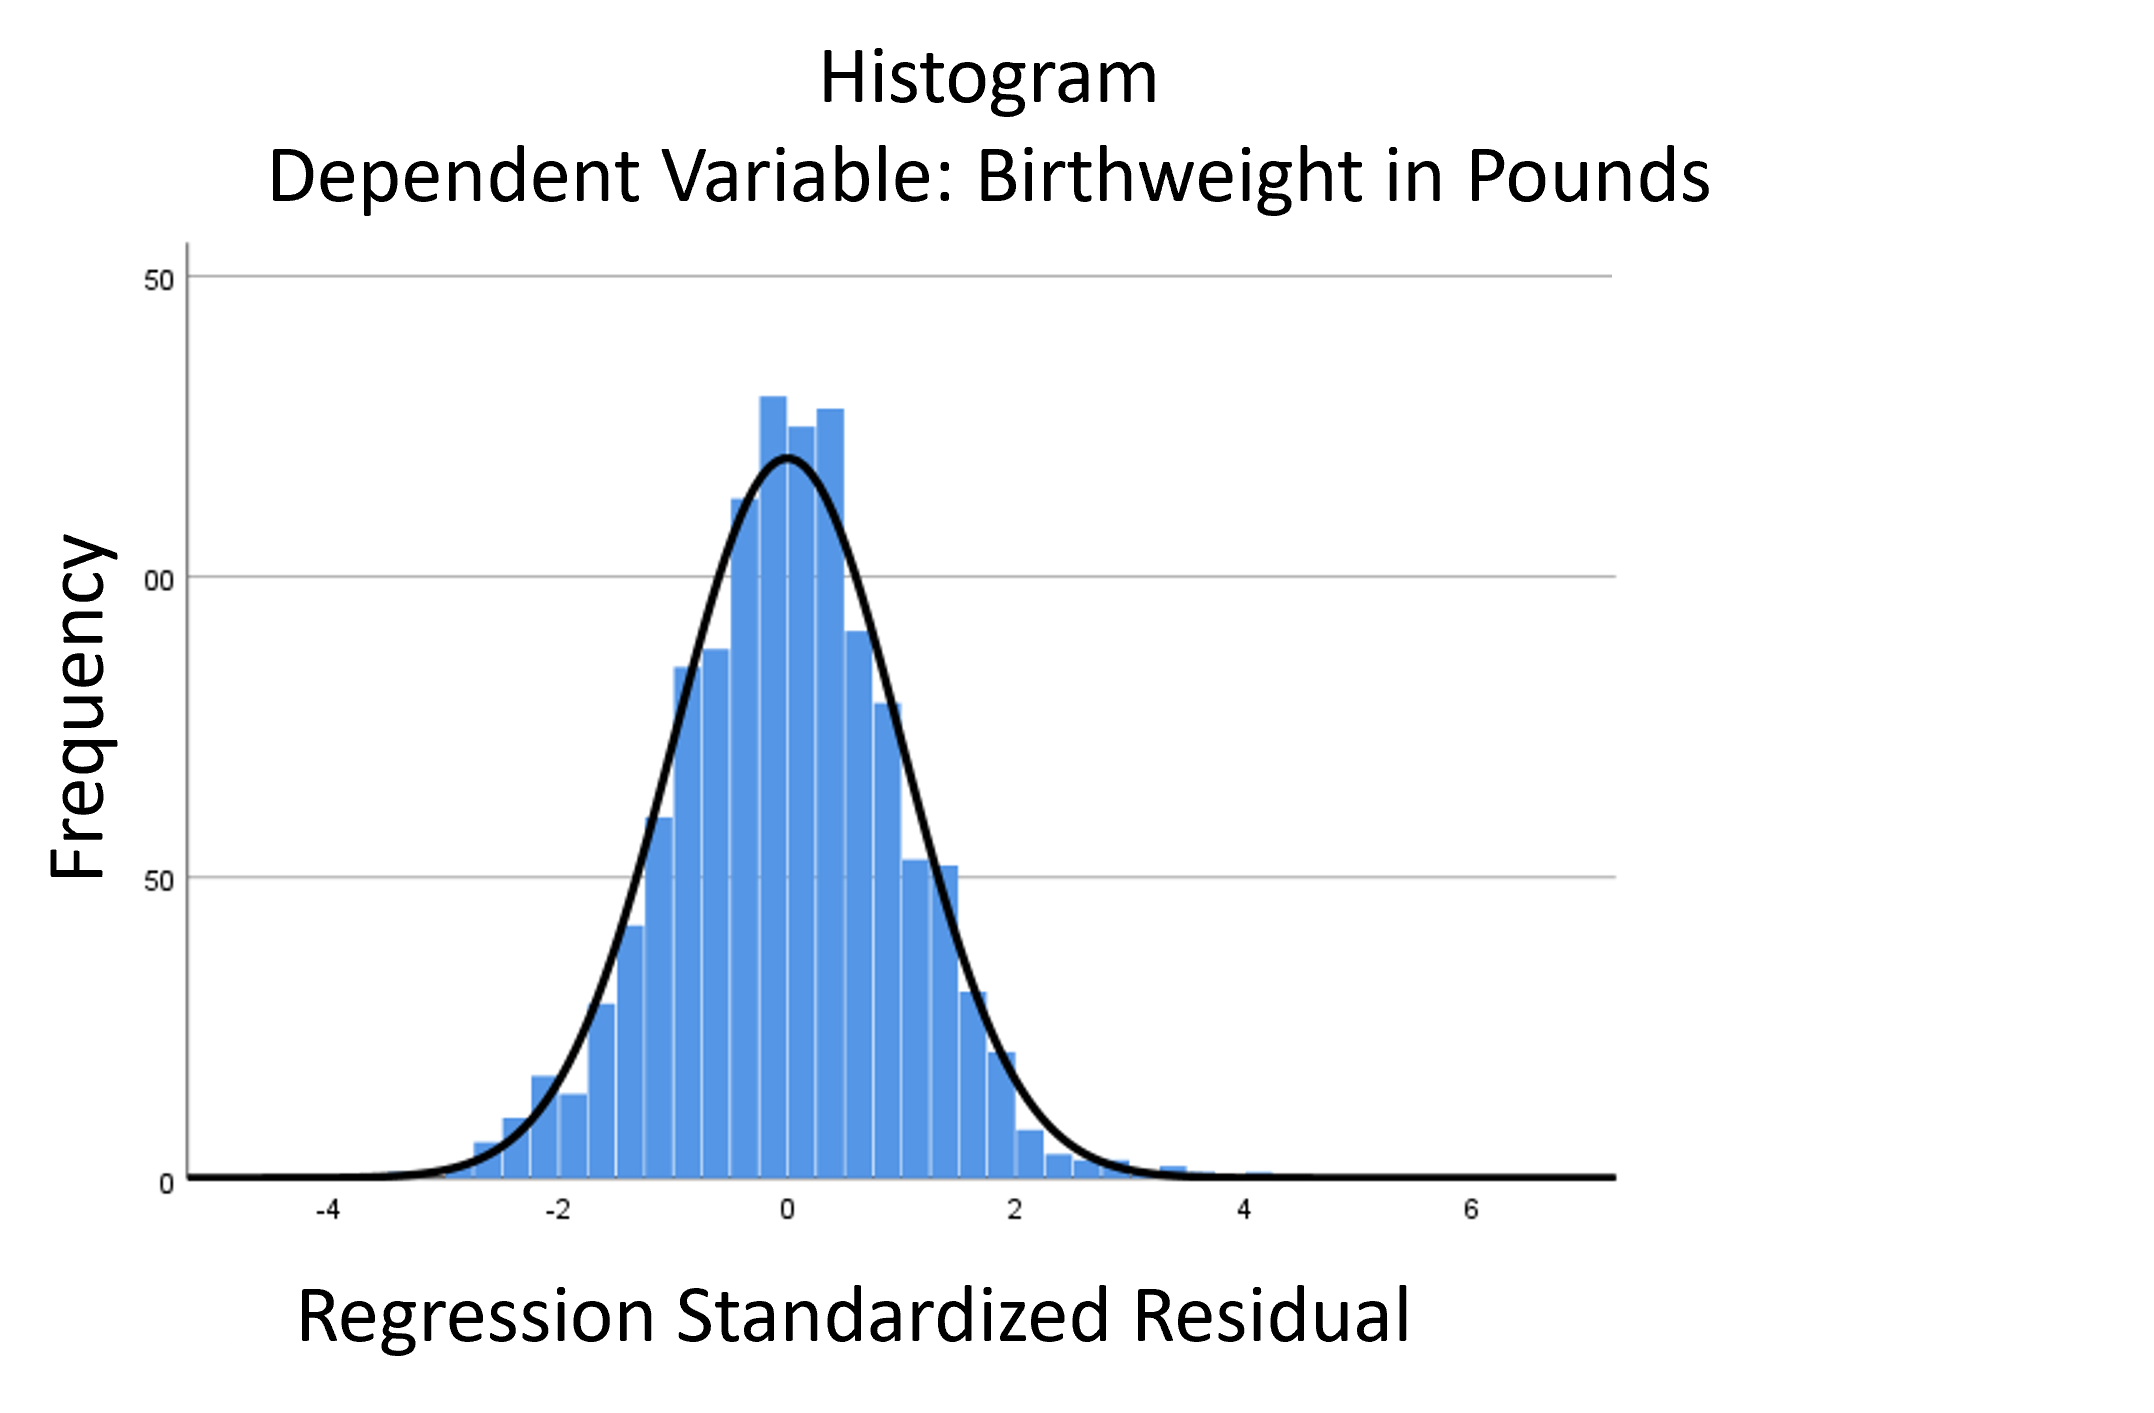
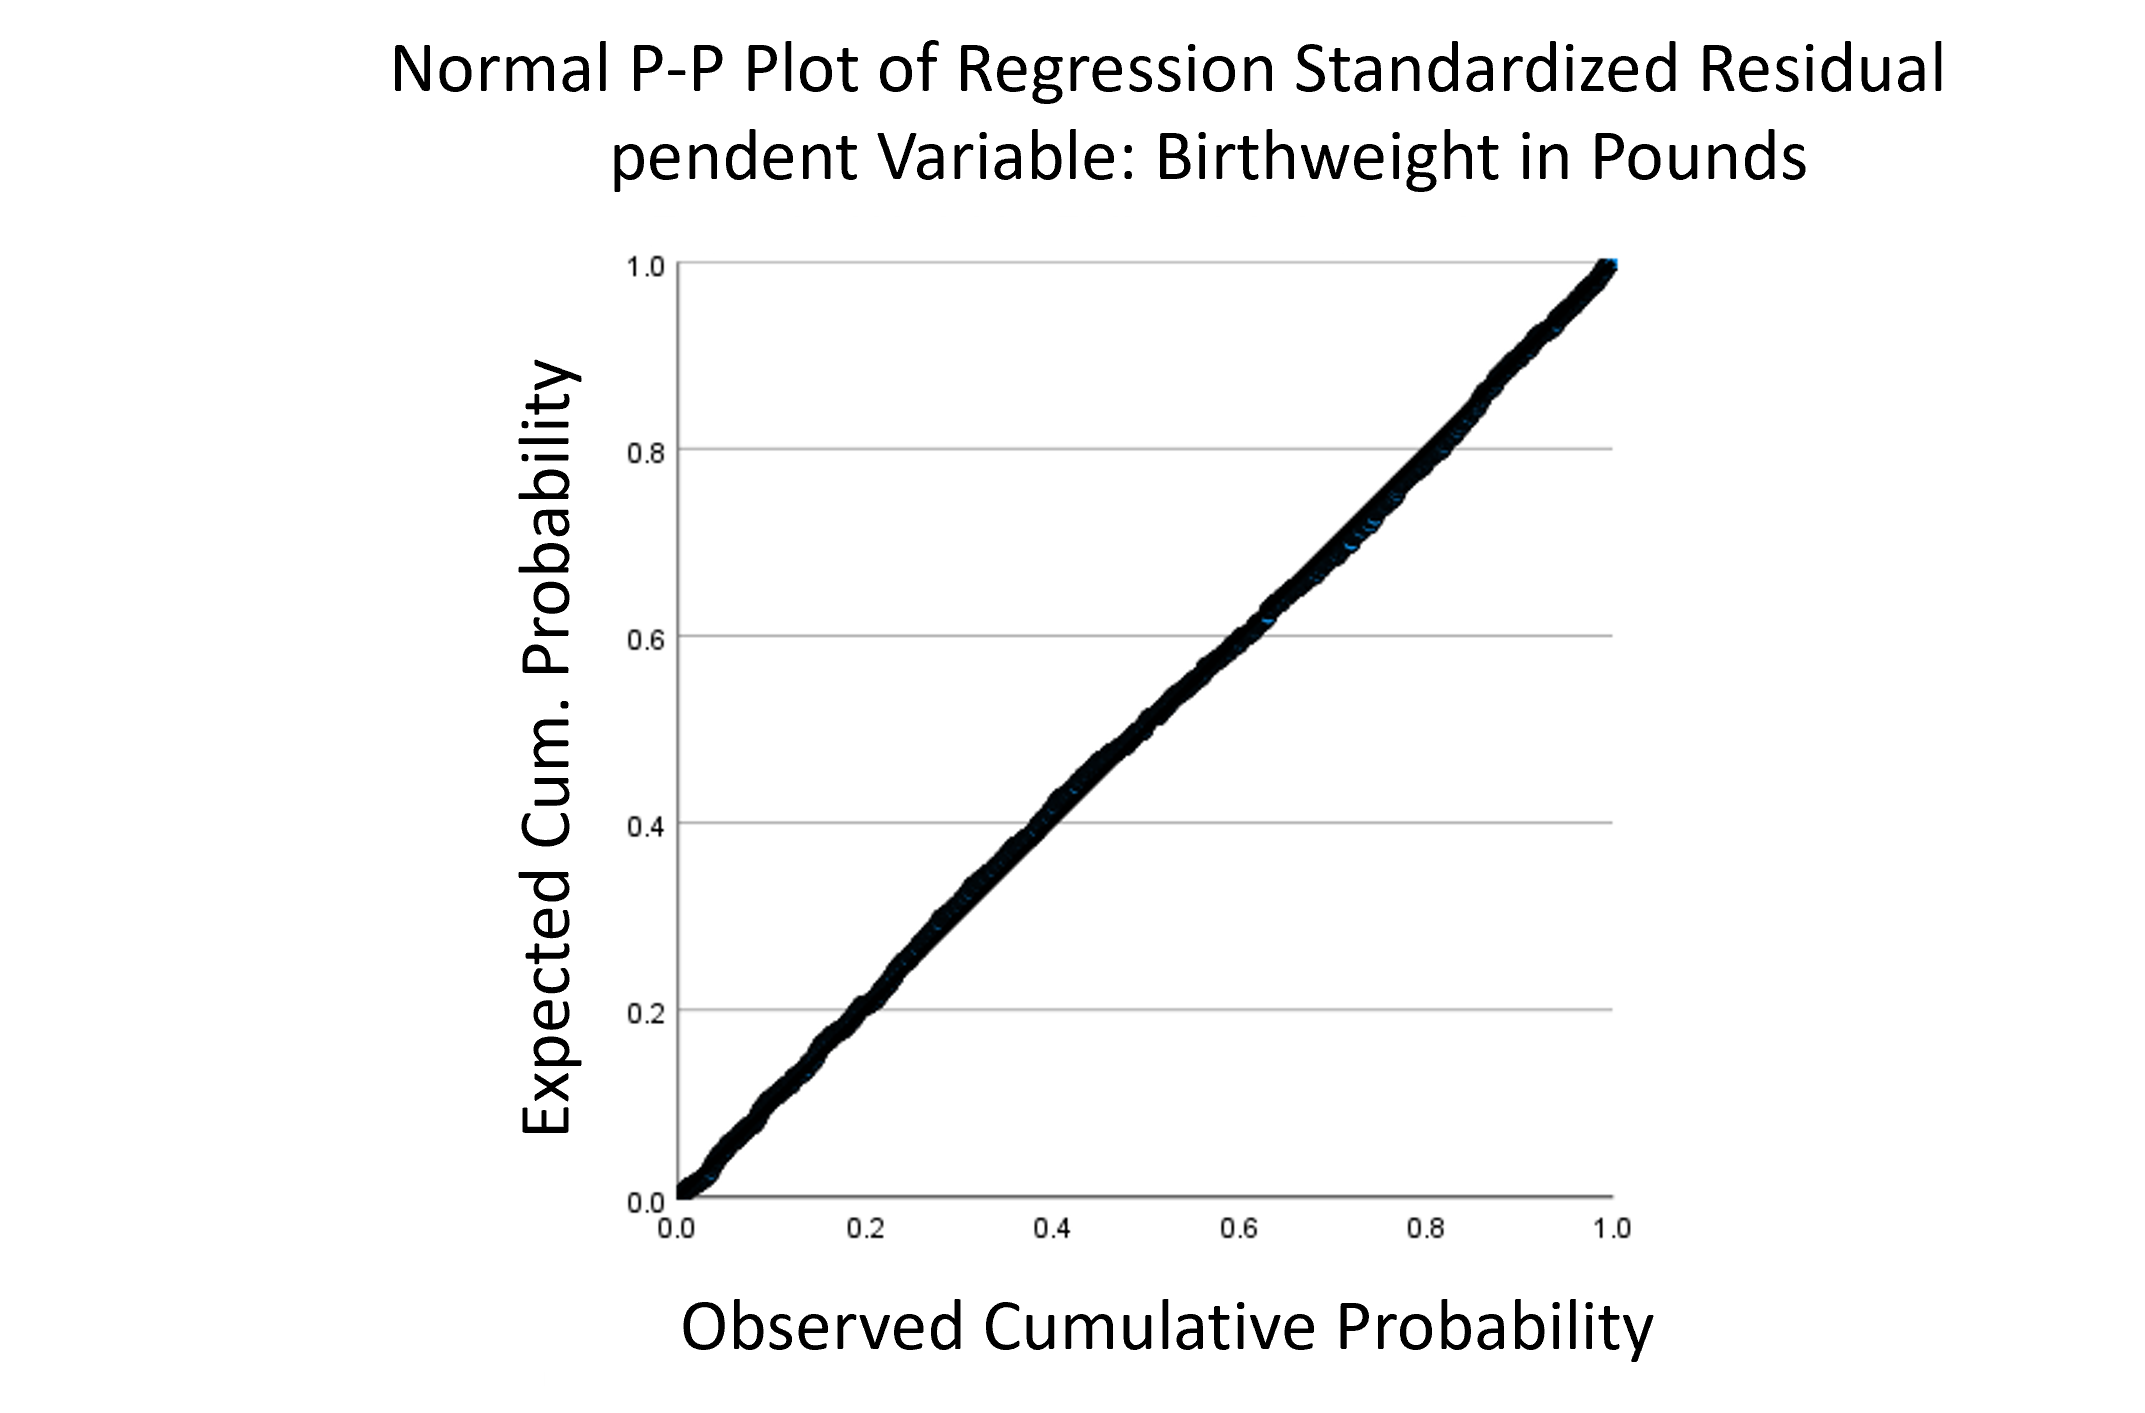
I mean, you can’t get a more perfectly straight line on a QQ plot that that!
The distribution of Y|X
As it turns out, the distribution of Y|X is the same as the distribution of the errors (as long as other assumptions hold). Y|X, remember is Y at a specific value of X.
You can think of the assumption this way. However, it’s really, really easy in every statistical software to save your residuals to directly check the distributional assumption of errors. Some linear model procedures give you plots of residuals by default.
And unless you have all categorical X variables, it’s not easy to save the values of Y|X. So best to just stick to checking residuals.
Updated 3/19/24

Hi Karen. Thanks for the post.
I just have one question to make sure I got your point. If I cannot reject the null of normally distributed residuals (for example, running an Anderson-Darling test), does this imply that p-values in an OLS regression are right and reliable, even though the Xs and Ys are not normal?
Cheers,
Tobia
Hi Tobia, No. You really don’t want to use a hypothesis test to check assumptions. See:
https://www.theanalysisfactor.com/the-problem-with-tests-for-statistical-assumptions/
https://www.theanalysisfactor.com/anatomy-of-a-normal-probability-plot/
Hello Karen. Thanks for this nice post on an issue that often confuses people. I have two minor comments. First, I think you meant to say interval OR ratio scale in the second to last paragraph. Second, I think it is useful (at least for more advanced users of statistics) to point out the important distinction between errors and residuals, as in this Wikipedia page:
http://en.wikipedia.org/wiki/Errors_and_residuals_in_statistics
The i.i.d. N(0, σ²) assumption applies to the errors, not the residuals. For example, if you give me n-1 of the residuals from your regression model, I can work out the last one, because they must sum to 0. So the residuals are not truly independent. The unobservable errors, on the other hand, can be truly independent.
Once again, thanks for a great post.
Cheers,
Bruce
Thanks Bruce. The answer got me confused on error and residual. This comment again re-installed faith in my understanding.
Hi Karen,
Since Y = E(Y) + ε, and E(Y) is a constant (function of X’s and betas), this should imply that the variance, independence and distributional assumptions on ε applies to Y as well. Am I right to say this?
Hi Kevin,
One small change that makes all the difference: Y=E(Y|X) + e. If every individual had the same value of X, then yes, the distribution of Y would match that of e. Since they generally differ, the Y’s are affected by the X’s but the residuals aren’t.
The distribution of Y|X is the same as the distribution of e, but the distribution of Y isn’t necessarily. I’ve seen many data sets where Y is skewed, but e is normal.
Karen