 I recently received a great question in a comment about whether the assumptions of normality, constant variance, and independence in linear models are about the errors, εi, or the response variable, Yi.
The asker had a situation where Y, the response, was not normally distributed, but the residuals were.
Quick Answer: It’s just the errors.
In fact, if you look at any (good) statistics textbook on linear models, you’ll see below the model, stating the assumptions: (more…)
If you’ve used much analysis of variance (ANOVA), you’ve probably heard that ANOVA is a special case of linear regression. Unless you’ve seen why, though, that may not make a lot of sense. After all, ANOVA compares means between categories, while regression predicts outcomes with numeric variables.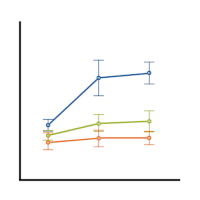 (more…)
Generalized linear models—and generalized linear mixed models—are called generalized linear because they connect a model’s outcome to its predictors in a linear way. The function used to make this connection is called a link function. Link functions sounds like an exotic term, but they’re actually much simpler than they sound.
For example, Poisson regression (commonly used for outcomes that are counts) makes use of a natural log link function as follows:
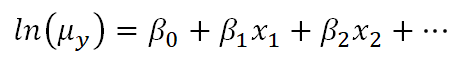
Clearly, there is not a direct linear relationship of the x variables to the average count, but there is a “sort of linear” relationship happening: a function of the mean of y is related to a linear combination of x variables. In other words, the linear model has now been generalized to a bigger type of situation.
This can lead to confusion, though, because on the surface it looks very similar to what happens when we transform the dependent variable in a linear model, like a linear regression.
The key thing to understand is that the natural log link function is a function of the mean of y, not the y values themselves.
Transformations of Y
Below is a linear model equation where the original dependent variable, y, has been natural log transformed. That is, the natural log has been taken of each individual value of y, and that is being used as the dependent variable.
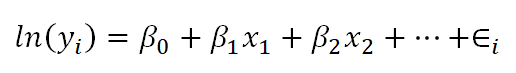
The linear model with the log transformation is providing an equation for an individual value of ln(y). We could also write it as follows, where we are modeling the mean of ln(y) (note the error term is no longer present):
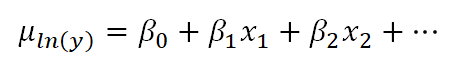
This makes the difference a bit clearer. When we transform the data in a linear model, we are no longer claiming that y is normally distributed around a mean, given the x values — we are claiming that our new outcome variable, ln(yi), is normally distributed.
In fact, we often make this transformation specifically because the values of y do not appear to be normally distributed around their average.
In the case of the Poisson model, however, the link function does not change the distribution of the actual observations in some way to make them something other than Poisson distributed. Instead, the link function defines the relationship of the x variables directly to the mean of the Poisson distributed y. The individual observations then vary around this expected value accordingly.
The mean of the log is not the log of the mean
As you may know, if you have used this kind of data transformation in a linear model before, you cannot simply take the exponent of the mean of ln(y) to get the mean of y.
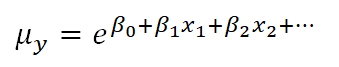
You might be surprised to know, though, that you can do this with a link function. If you have specific values of your x variables, you can calculate the predicted average count, μy based on those x values by inversing the natural log:
This ability to back-transform means (and regression coefficients) to a more intuitive scale is part of what makes generalized linear models so useful.
Go to the next article or see the full series on Easy-to-Confuse Statistical Concepts
In a previous post we discussed using marginal means to explain an interaction to a non-statistical audience. The output from a linear regression model can be a bit confusing. This is the model that was shown.
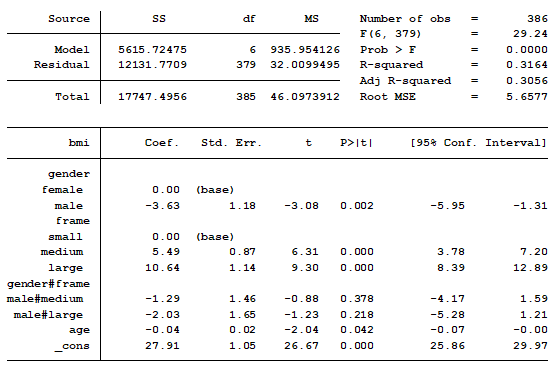
In this model, BMI is the outcome variable and there are three predictors:
(more…)
Pretty much all of the common statistical models we use, with the exception of OLS Linear Models, use Maximum Likelihood estimation.
This includes favorites like:
That’s a lot of models.
If you’ve ever learned any of these, you’ve heard that some of the statistics that compare model fit in competing models require (more…)
