When you draw a graph- either a bar chart, a scatter plot, or even a pie chart, you have the choice of a broad range of colors that you can use. R, for example, has 657 different colors from aliceblue to yellowgreen. SAS has 13 shades of orange, 33 shades of blue, and 47 shades of green. They even have different shades of black.
You have a wealth of colors, but you can’t use all of them in the same graph. The ideal number of colors is 2.
Using Color for Emphasis
Here’s a brief exercise. It is adapted from an example of Todd Iverson and Silas Bergen in a course they teach on data visualization. Set a time and count the number of 5’s in this graph.
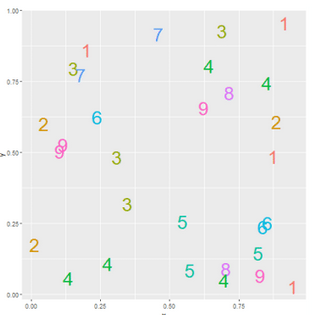
It took a bit of time. I tried to help you by using a different color for each number. I hope it helped. Let’s try that exercise again. Count the number of fives one more time..
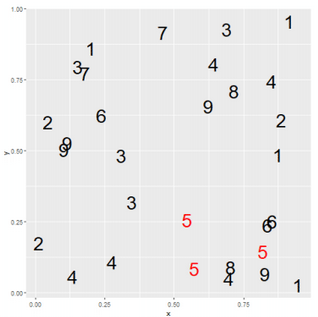
Were you faster were you this time? Much faster, I’m guessing, and it’s because only two colors were used.
Use two colors when you want to draw emphasis to a particular subgroup on your graph. Okay, you might claim foul here. It’s easier to pick the 5’s, but not so easy to pick the 4’s and 7’s.
Fair enough, but this is something you should always consider when drawing a graph.
What elements of the graph do you want to emphasize? You can’t emphasis some elements without de-emphasizing others. If you use a different color for each group, you end up emphasizing none of the groups.
Here’s another lesson that I learned from Naomi Robbins, another expert on data visualization. She points out that you don’t make every word in a sentence a different color. You use a single color to draw emphasis to a particular word or phrase. The same should be true for your graphs.
Using Color Gradients to Improve Graphs
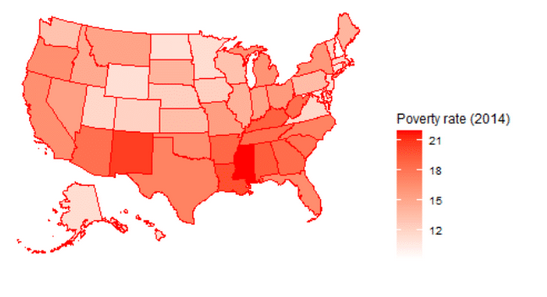
Restraint is also important for gradients. Often in a graph, you want to show changes in a continuous variable across a range of colors. Here’s a map with a transition from a very light red to a very dark red. You can also show a transition between different colors.
The map below transitions from green to yellow to red. This color scheme is used commonly in genomic data visualizations.
Using Too Many Colors in a Graph
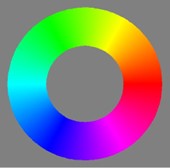
But what you can’t do is use all the colors in the rainbow.
This image shows the rainbow gradient. It transitions between red, yellow, green, cyan, blue, and magenta. These are the fundamental colors on your computer display.
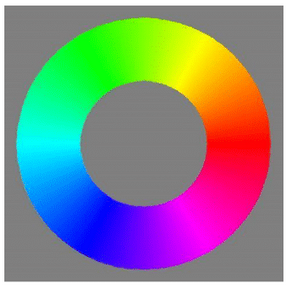
Although the rainbow gradient is used a lot in computer visualizations, it is widely derided by visualization experts.
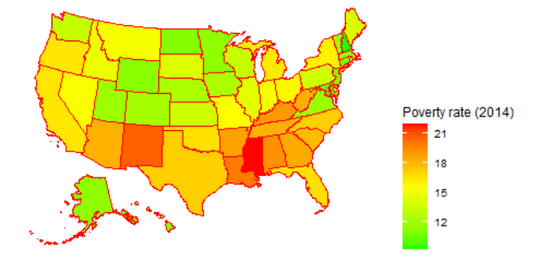
Here’s what a map of poverty rates looks like with the rainbow gradient.
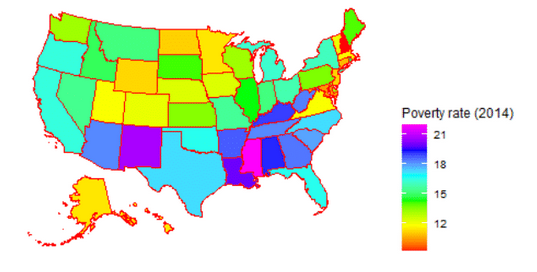
And there are many problems with the full rainbow of colors.
First, the ends of the rainbow do not show enough contrast. In the above map, the low poverty rate of New Hampshire is a red that differs from high poverty rate of Mississippi shown as magenta.
Second, the transitions in the rainbow gradient are uneven. This leads to a banding effect which distorts the continuous scale.
Third, the colors in the rainbow gradient can sometimes come across as harsh. This is subjective, of course, but colors that are a bit lighter or a bit darker than the rainbow often are easier on the eyes.
Main Takeaway
Your computer can display over 16 million colors on the screen. The temptation is to cram a lot of different colors into a single graph. But a bit of discretion is important here. Less if often more when it comes to colors in your data visualization.
By: Steve Simon

Leave a Reply