One issue with using tests of significance is that black and white cut-off points such as 5 percent or 1 percent may be difficult to justify.
Significance tests on their own do not provide much light about the nature or magnitude of any effect to which they apply.
One way of shedding more light on those issues is to use confidence intervals. Confidence intervals can be used in univariate, bivariate and multivariate analyses and meta-analytic studies.
What Determines the Width of the Confidence Interval?
A narrow confidence interval enables more precise population estimates. The width of the confidence interval is a function of two elements:
- Confidence level
- Sampling error
The greater the confidence level, the wider the confidence interval.
If we assume the confidence level is fixed, the only way to obtain more precise population estimates is to minimize sampling error.
Sampling error is measured by the standard error statistic. The size of the standard error is due to two elements:
- The sample size
- Variation in the population
Usually there is little that we can do about changing variation in the population.
One thing we can do is to increase the sample size. As a general guide, to halve the standard error the sample size must be quadrupled.
Very precise population estimates with little margin for error require large sample sizes and/or resampling techniques like bootstrapping. However, in cases where such precision is not required there is a point where the gain in precision is not worth the cost of increasing the size of the sample.
How to Interpret Confidence Intervals for Means
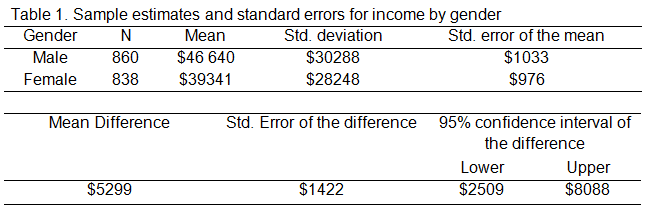
The figures in Table 1 below were obtained for the average income of males and females in a fictitious survey for unemployment. How much better do males do than females in the income stakes?
The sample estimate, based on 1698 respondents, is that males, on average, earn $5299 more than females ($44,640 – $39,341).
That, of course, is the difference in the sample. What is the difference between males and females likely to be in the population?
The table indicates this difference in the sample ($5299) and provides the standard error of this difference ($1422).
Applying the 95 percent rule, the table also displays the confidence interval: we can be 95 percent confident that the real male-female income difference in the population is between $2509 and $8088.
Confidence intervals are focused on precision of estimates — confidently use them for that purpose!

Male mean in the table $46,640 is does not tally with the male mean in the text $44,640
What is a relative confidence limit ? If for a given arithmetic mean value, 0.91%, given relative confidence limit(100*▲c/c) is 3.5 then what is the tolerance for this 0.91 value?
This is simply great! I am in love with this site:)
Thanks Karen and Team.