|
A Note From Karen
It's that time of year--the ending of the semester, the finishing of dissertations, the preparation for summer conferences.
We too have a lot going on. Next week is our next the Craft of Statistical Analysis Webinar: Analysis of Complex Sample Surveys Made Simple by guest presenter Dr. Trent Buskirk. If you have ever wondered about using survey weights or the difference between stratification and clustering, please join us. It's free.
I'm also pleased to announce that in our next workshop, Logistic Regression, we will now be including Stata examples as well as SPSS and SAS, courtesy of longtime Stata user Jeff Meyer of Optimizing Outcomes. I realize that it's always ideal to take workshops with examples in the software you use, and Stata has particular strengths in logistic regression. So thanks, Jeff. That workshop begins May 29.
In beginning to prepare for that workshop, I realized I don't have many articles on logistic regression. So please enjoy this article on one of the most fundamental concepts in logistic regression: the logit function.
Happy analyzing!
Karen
Feature Article: What is a Logit Function and Why Use Logistic Regression?
One of the big assumptions of linear models is that the residuals are normally distributed. This doesn't mean that Y, the response variable, has to also be normally distributed, but it does have to be continuous, unbounded and measured on an interval or ratio scale.
Unfortunately, categorical response variables are none of these.
No matter how many transformations you try, you're just never going to get normal residuals from a model with a categorical response variable.
There are a number of alternatives though, and one of the most popular is logistic regression.
In many ways, logistic regression is very similar to linear regression. One big difference, though, is the logit link function.
The logit link function
A link function is simply a function of the mean of the response variable Y that we use as the response instead of Y itself. So all that means is when Y is categorical, we use the logit of Y as the response in our regression equation instead of just Y:

The logit function is simply the natural log of the odds that Y equals one of the categories. For mathematical simplicity, we're going to assume Y has only two categories and code them as 0 and 1.
This is entirely arbitrary--we could have used any numbers. But these make the math work out nicely, so let's stick with them.
P is defined as the probability that Y=1. So for example, those Xs could be specific risk factors, like age, high blood pressure, and cholesterol level, and P would be the probability that a patient develops heart disease.
Why do we need to bother with this logit function?
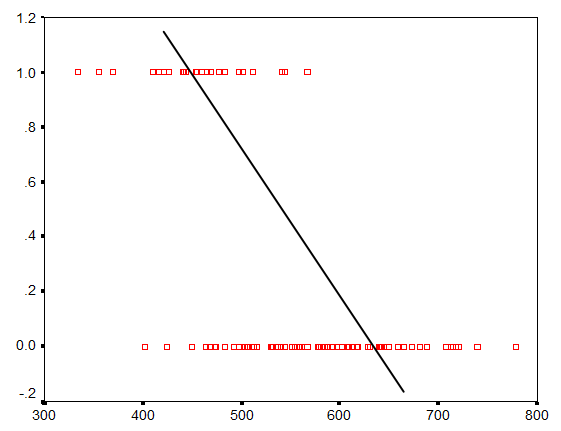
Well, if we used Y as the outcome variable and tried to fit a line, it wouldn't be a very good representation of the relationship. The following graph shows an attempt to fit a line between one X variable and a binary outcome Y.
You can see a relationship there--higher values of X are associated with more 0s and lower values of X have more 1s. But it's not a linear relationship.
Okay, fine. But why mess with logs and odds? Why not just use P as the outcome variable? Everyone understands probability.
Here's the same graph with probability on the Y axis:
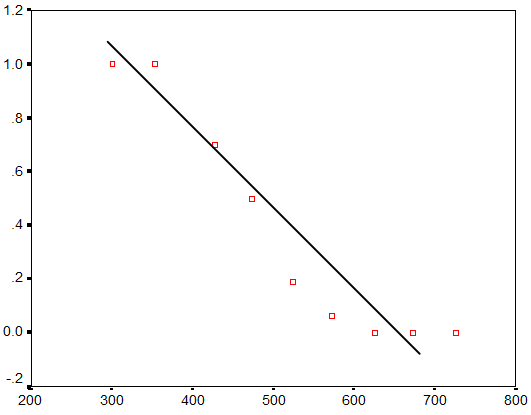
It's closer to being linear, but it's still not quite there. Instead of a linear relationship between X and P, we have a sigmoidal or S-shaped relationship.
But it turns out that there are a few functions of P that do form reasonably linear relationships with X. These include:
- Square root of arcsin
- Complimentary log-log
- Probit
- Logit
The logit function is particularly popular because, believe it or not, its results are relatively easy to interpret. But many of the others work just as well. Once we fit this model, we can then back-transform the estimated regression coefficients off of a log scale so that we can interpret the conditional effects of each X.
Further Reading and Resources
|