|
A Note From Karen
 I hope you’re having a great summer (or winter, as the case may be). I hope you’re having a great summer (or winter, as the case may be).
We’ve been taking it a little slow here in the office so we can enjoy our brief, but lovely summer here in Ithaca. But we’re starting to gear up for fall, and are getting excited about some of our plans.
Coming up next month are two of our most popular workshops: Introduction to Data Analysis with R and Analyzing Repeated Measures Data.
We also have a brand new workshop planned for later in the fall. We’ll let you know all the details once we’ve got everything ready, but I’ll just hint that it’s our first workshop about using Stata.
And in the meantime, I hope you enjoy this article on two simple, but very useful tests.
Happy analyzing!
Karen
Feature Article: The Difference Between a Chi-Square Test and a McNemar test
You may have heard of McNemar tests as a repeated measures version of a chi-square test of independence. This is basically true, and I wanted to show you how these two tests differ and what exactly, each one is testing.
First of all, although Chi-Square tests can be used for larger tables, McNemar tests can only be used for a 2x2 table. So we’re going to restrict the comparison to 2x2 tables.
The Chi-square test
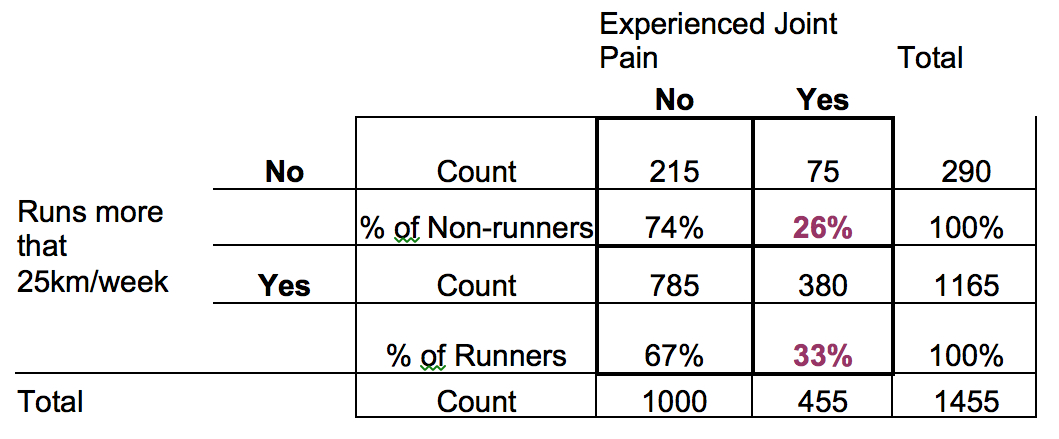
Here’s an example of a contingency table that would typically be tested with a Chi-Square Test of Independence:

The Chi-Square will test whether Experiencing Joint Pain is associated with running more than 25km/week.
How is it doing that?
The chi-square statistic itself is calculated based on the counts of people in each of those four cells of the table and their subsequent row and column totals.
But the comparison it essentially boils down to is the comparison of the two purple percentages. You’ll notice each of these percentages is based on the row total. In other words, the 75 non-runners answering Yes to Joint Pain represent 26% of the 290 non-runners*.
But 33% of the 1165 Runners said Yes, they’ve experienced joint pain. A higher proportion of runners than non-runners are experiencing joint pain.
If those percentages were the same, the chi-square test statistic would be zero and it would mean that whether someone runs tells you nothing about whether they have join pain.
They’re not associatied.
*As a non-runner myself, I’m being strict here in the definition of a “runner” as someone who runs at least 25k/week. All others I’m calling non-runners for simplicity.
The McNemar Test
A McNemar test does something different.
The McNemar is not testing for independence, but consistency in responses across two variables.
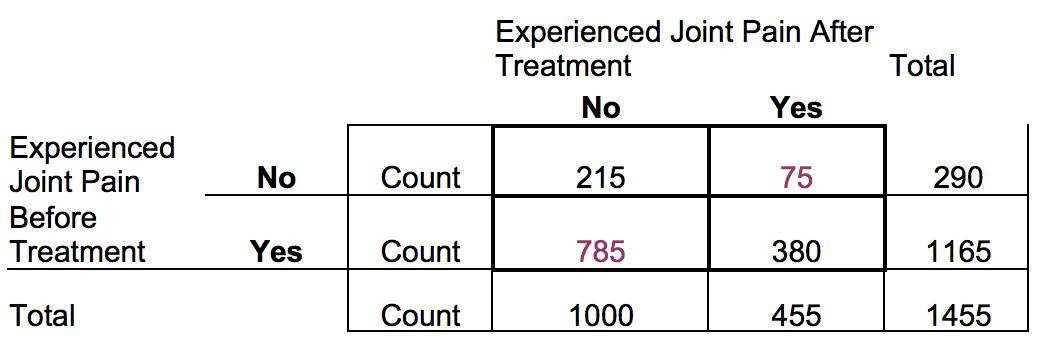
Here is a table with the exact same counts, but different variables. Now we’re comparing whether someone experiences joint pain before and after some treatment. We want to test whether the treatment worked to change people from Yes to No.

But the McNemar recognizes that some people will move from Yes to No and others from No to Yes just randomly. If the treatment is having no effect, the number of people who move from No to Yes should be about equal to those who move in the other direction.
But if there is a direction to the movement, we’ll see it because one of those purple boxes will be different from the other.
The 215 people who said no at both time points and the 380 people who said Yes at both are actually irrelevant to this comparison. We’re actually just interested in whether the people who change answers do so randomly or not.
In the McNemar test, we can compare counts directly, because the comparison is not based on row totals. But if changing to percentages makes interpretation easier, that’s fine too. Just make sure you use percentage of the total sample, not percentage of the row totals, as we did for Chi-square.
References and Further Reading:
McNemar Tests of Marginal Homogeneity
McNemar’s Test For Correlated Proportions in the Marginals of a 2x2 Contingency Table
Chi-square test vs. Logistic Regression: Is a fancier test better? |
