The Meanings of Interaction and Association
It’s really easy to mix up the concepts of association (a.k.a. correlation) and interaction. Or to assume if two variables interact, they must be associated. But it’s not actually true.
In statistics, they have different implications for the relationships among your variables, especially when the variables you’re talking about are predictors in a regression or ANOVA model.
Association
Association between two variables means the values of one variable relate in some way to the values of the other. Association is usually measured by correlation for two continuous variables and by cross tabulation and a Chi-square test for two categorical variables.
Unfortunately, there is no nice, descriptive measure for association between one categorical and one continuous variable, but either one-way analysis of variance or logistic regression can test an association (depending upon whether you think of the categorical variable as the independent or the dependent variable).
Essentially, association means the values of one variable generally co-occur with certain values of the other.
Interaction
Interaction is different. Whether two variables are associated says nothing about whether they interact in their effect on a third variable. Likewise, if two variables interact, they may or may not be associated.
An interaction between two variables means the effect of one of those variables on a third variable is not constant—the effect differs at different values of the other.
What Association and Interaction Describe in a Model
The following examples show three situations for three variables: X1, X2, and Y. X1 is a continuous independent variable, X2 is a categorical independent variable, and Y is the dependent variable. I chose these types of variables to make the plots easy to read, but any of these variables could be either categorical or continuous.
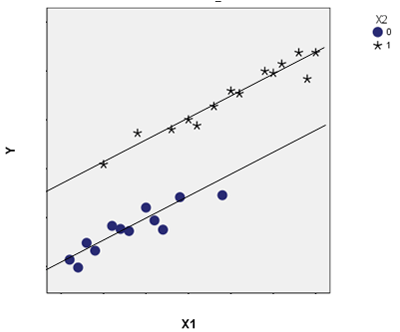
In scenario 1, X1 and X2 are associated. If you ignore Y, you can see the mean of X1 is lower when X2=0 than when X2=1. But they do not interact in how they affect Y—the regression lines are parallel. X1 has the same effect on Y (the slope) for both X2=1 and X2=0.
A simple example is the relationship between height (X1) and weight (Y) in male (X2=0) and female (X2=1) teenagers. There is a relationship between height (X1) and gender (X2), but for both genders, the relationship between height and weight is the same.
This is the situation you’re trying to take care of by including control variables. If you didn’t include gender as a control, a regression would fit a single line to all these points and attribute all variation in weights to differences in heights. This line would also be steeper, as it tried to fit all the points using one line, and it would overestimate the size of the unique effect of height on weight. 
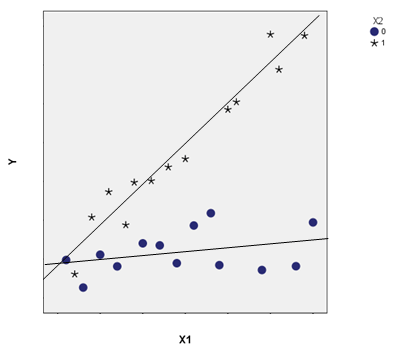
In a second scenario, X1 and X2 are not associated—the mean of X1 is the same for both categories of X2. But how X1 affects Y differs for the two values of X2—the definition of an interaction. The slope of X1 on Y is greater for X2=1 than it is for X2=0, in which it is nearly flat.
An example of this would be an experiment in which X1 was a pretest score and Y a posttest score. Imagine participants were randomly assigned to a control (X2=1) or a training (X2=0) condition.
If randomization is done well, the assigned condition (X2) should be unrelated to the pretest score (X1). But they do interact—the relationship between pretest and posttest differs in the two conditions.
In the control condition, without training, the pretest and posttest scores would be highly correlated, but in the training condition, if the training worked well, pretest scores would have less effect on posttest scores.

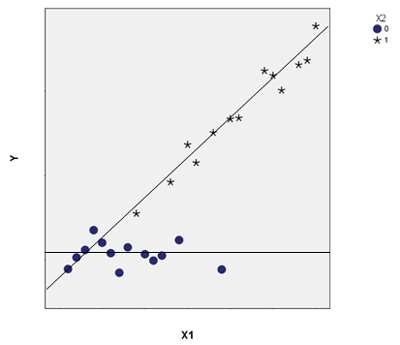
In the third scenario, we’ve got both an association and an interaction. X1 and X2 are associated—once again the mean of X1 is lower when X2=0 than when X2=1. They also interact with Y—the slopes of the relationship between X1 and Y are different when X2=0 and X2=1. So X2 affects the relationship between X1 and Y.
A good example here would be if Y is the number of jobs in a county, X1 is the percentage of the workforce that holds a college degree, and X2 is whether the county is rural (X2=0) or metropolitan (X1=0).
It’s clear rural counties have, on average, lower percentages of college-educated citizens than metropolitan counties. They also have fewer jobs.
It’s also clear that the workforce’s education level in metropolitan counties is related to how many jobs there are. But in rural counties, it doesn’t matter at all.
This situation is also what you would see if the randomization in the last example did not go well or if randomization was not possible.

The differences between Interaction and Association will become clearer as you analyze more data. It's always a good idea to stop and explore your data through graphs or by trying different terms in your model to figure out exactly what's going on with your variables. |
