Okay, maybe these SPSS shortcuts won’t make your whole life easier, but it will help your work life, at least the SPSS part of it.
When I consult with researchers, a common part of that is going through their analysis together. Sometimes I notice that they’re using some shortcut in SPSS that I had not known about.
Or sometimes they could be saving themselves some headaches.
So I thought I’d share three buttons you may not have noticed before that will make your data analysis more efficient.
1. The Paste Button
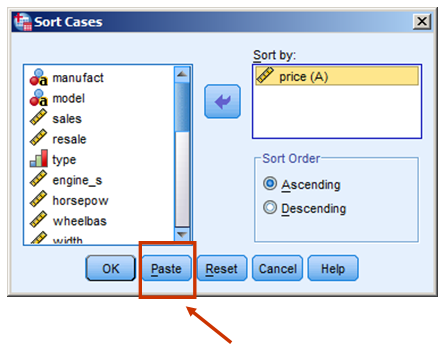
This is the #1 most helpful button, because recording and using syntax has so many advantages.
Virtually every dialog window in SPSS has a Paste button, and it’s right next to OK.
Whenever you use the menus and dialog windows in SPSS, behind the scenes, SPSS is creating the underlying syntax that actually will run the options you’re choosing. Then when you choose the OK button, it actually runs your syntax. If instead you click Paste, that puts a copy of that underlying syntax into a syntax window for you. You can then run it or copy and edit it with, say, other variables or options.
This, to me, is one of the great advantages of SPSS: you don’t have to remember every coding option in order to code the syntax. Just run the dialog box, choose the options you want, and hit Paste.
And yet you still get every advantage that syntax gives you, like the efficiency and reproducibility.
It works not just for analyses, but opening files, doing data manipulations – just about anything you need SPSS to do.
2. The History Button
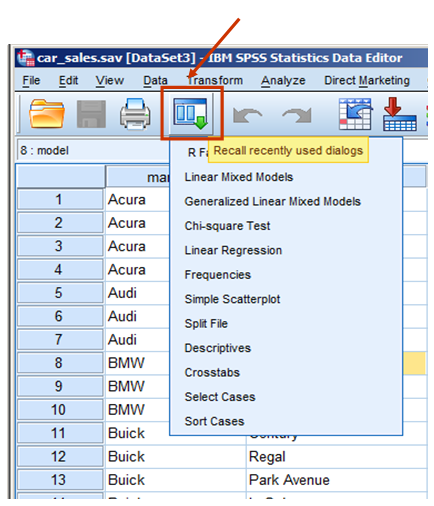
Another of my favorite SPSS shortcuts is the History button.
When you’re using the menus + dialogs, you will inevitably have a situation where you need to redo an analysis or data manipulation. Maybe just change an option.
Rather than go trough the menus again, just hit the History button.
It will display about 10 recent dialogs you’ve used. When you click on one of those dialogs in the list, it brings the dialog up, complete with the variables and options you used the last time.
Is it a huge time saver? No. But it adds up and reduces a LOT of tedium.
Take the Chi-Square test as as example. Using the menus requires going to Analyze–>Nonparametrics–>Legacy Dialogs–>Chi Square. That’s a lot of finding things within menus, vs. two clicks for the History button.
3. The Variables Button
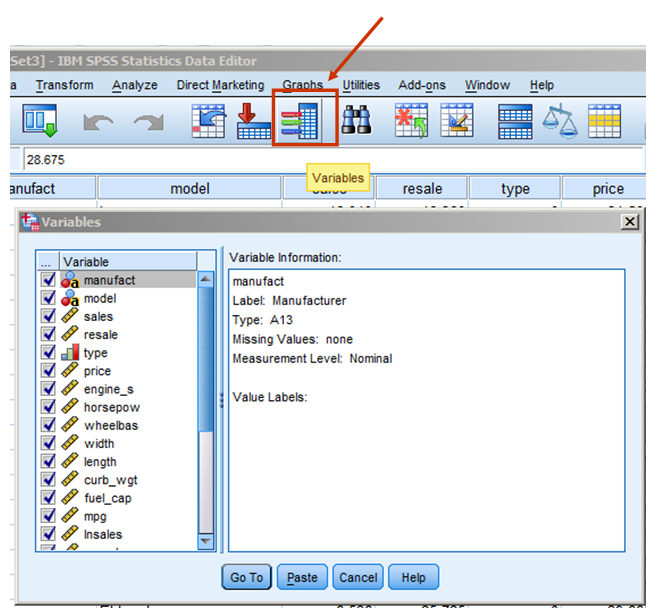
Another very helpful button is the Variables button.
Clicking it brings up the Variables window, which is really just a list of the variables, with variable information about each one.
What’s the big deal? you ask. (I can hear you). Why not just look in the Variable View tab?
Agreed. Many times that’s all you need. The problem this solves is when you have a large data set, and you want to easily find the variable you want. If you know its name or at least that it starts with “wei” for example, you can simply do the following:
1. Click on the variable list.
2. Without pausing, type the name of the variable. If you’re looking for a variable “weight”, as you type, it will go to the next variable that begins with w, then we, then wei, etc. As soon as you pause, it will stop looking.
If there are 14 versions of variables that all start with “wei” (eg. weight1, weight2, etc.) and you can’t remember which one you want, just keep typing “wei” until you hit the one you need.
You can then either click “Go To” to go directly to that variable in the data set or “Paste” to paste that variable name into whatever syntax you were just writing.
Have any favorite SPSS shortcuts? Share them below and I’ll add them to the list.

Karen
Another useful facility is:
Data > Define Variable Properties.
t’s supposed to be for building up a saved file, but I use it for checking existing files, particularly other people’s. It’s particularly good when you want to check value labels and missing values, especially if they have not been declared, even if they have been labelled. The big advantage is that as well as displaying variable properties it also shows counts for each value encountered. If you change any of the properties of any variable it produces syntax to send to the active syntax editor. Sometimes the syntax is incredibly repetitive, but it’s accurate. I usually edit this down later to avoid all those repeat commands.
Another facility I didn’t know about is one for changing the order in which columns are displayed in Variable View. I used to drag them to new positions by highlighting the column header, but you can also use:
View > Customize variable View
in which you can check or uncheck attributes to display and also move them up and down the order of display.
John