Just recently, a client got some feedback from a committee member that the Analysis of Covariance (ANCOVA) model she ran did not meet all the  assumptions.
Specifically, the assumption in question is that the covariate has to be uncorrelated with the independent variable.
This committee member is, in the strictest sense of how analysis of covariance is used, correct.
And yet, they over-applied that assumption to an inappropriate situation.
ANCOVA for Experimental Data
Analysis of Covariance was developed for experimental situations and some of the assumptions and definitions of ANCOVA apply only to those experimental situations.
The key situation is the independent variables are categorical and manipulated, not observed.
The covariate–continuous and observed–is considered a nuisance variable. There are no research questions about how this covariate itself affects or relates to the dependent variable.
The only hypothesis tests of interest are about the independent variables, controlling for the effects of the nuisance covariate.
A typical example is a study to compare the math scores of students who were enrolled in three different learning programs at the end of the school year.
The key independent variable here is the learning program. Students need to be randomly assigned to one of the three programs.
The only research question is about whether the math scores differed on average among the three programs. It is useful to control for a covariate like IQ scores, but we are not really interested in the relationship between IQ and math scores.
So in this example, in order to conclude that the learning program affected math scores, it is indeed important that IQ scores, the covariate, is unrelated to which learning program the students were assigned to.
You could not make that causal interpretation if it turns out that the IQ scores were generally higher in one learning program than the others.
So this assumption of ANCOVA is very important in this specific type of study in which we are trying to make a specific type of inference.
ANCOVA for Other Data
But that’s really just one application of a linear model with one categorical and one continuous predictor. The research question of interest doesn’t have to be about the causal effect of the categorical predictor, and the covariate doesn’t have to be a nuisance variable.
A regression model with one continuous and one dummy-coded variable is the same model (actually, you’d need two dummy variables to cover the three categories, but that’s another story).
The focus of that model may differ–perhaps the main research question is about the continuous predictor.
But it’s the same mathematical model.
The software will run it the same way. YOU may focus on different parts of the output or select different options, but it’s the same model.
And that’s where the model names can get in the way of understanding the relationships among your variables. The model itself doesn’t care if the categorical variable was manipulated. It doesn’t care if the categorical independent variable and the continuous covariate are mildly correlated.
If those ANCOVA assumptions aren’t met, it does not change the analysis at all. It only affects how parameter estimates are interpreted and the kinds of conclusions you can draw.
In fact, those assumptions really aren’t about the model. They’re about the design. It’s the design that affects the conclusions. It doesn’t matter if a covariate is a nuisance variable or an interesting phenomenon to the model. That’s a design issue.
The General Linear Model
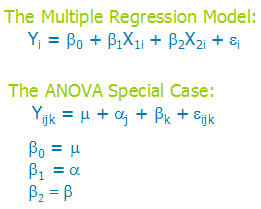
So what do you do instead of labeling models? Just call them a General Linear Model. It’s hard to think of regression and ANOVA as the same model because the equations look so different. But it turns out they aren’t.

If you look at the two models, first you may notice some similarities.
- Both are modeling Y, an outcome.
- Both have a “fixed” portion on the right with some parameters to estimate–this portion estimates the mean values of Y at the different values of X.
- Both equations have a residual, which is the random part of the model. It is the variation in Y that is not affected by the Xs.
But wait a minute, Karen, are you nuts?–there are no Xs in the ANOVA model!
Actually, there are. They’re just implicit.
Since the Xs are categorical, they have only a few values, to indicate which category a case is in. Those j and k subscripts? They’re really just indicating the values of X.
(And for the record, I think a couple Xs are a lot easier to keep track of than all those subscripts. Ever have to calculate an ANOVA model by hand? Just sayin’.)
So instead of trying to come up with the right label for a model, focus instead on understanding (and describing in your paper) the measurement scales of your variables, if and how much they’re related, and how that affects the conclusions.
In my client’s situation, it was not a problem that the continuous and the categorical variables were mildly correlated. The data were not experimental and she was not trying to draw causal conclusions about only the categorical predictor.
So she had to call this ANCOVA model a multiple regression.
