In the past few months, I’ve gotten the same question from a few clients about using linear mixed models for repeated measures data. They want to take advantage of its ability to give unbiased results in the presence of missing data. In each case the study has two groups complete a pre-test and a post-test measure. Both of these have a lot of missing data.
The research question is whether the groups have different improvements in the dependent variable from pre to post test.
As a typical example, say you have a study with 160 participants.
90 of them completed both the pre and the post test.
Another 48 completed only the pretest and 22 completed only the post-test.
Repeated Measures ANOVA will deal with the missing data through listwise deletion. That means keeping only the 90 people with complete data. This causes problems with both power and bias, but bias is the bigger issue.
Another alternative is to use a Linear Mixed Model, which will use the full data set. This is an advantage, but it’s not as big of an advantage in this design as in other studies.
The mixed model will retain the 70 people who have data for only one time point. It will use the 48 people with pretest-only data along with the 90 people with full data to estimate the pretest mean.
Likewise, it will use the 22 people with posttest-only data along with the 90 people with full data to estimate the post-test mean.
If the data are missing at random, this will give you unbiased estimates of each of these means.
But most of the time in Pre-Post studies, the interest is in the change from pre to post across groups.
The difference in means from pre to post will be calculated based on the estimates at each time point. But the degrees of freedom for the difference will be based only on the number of subjects who have data at both time points.
So with only two time points, if the people with one time point are no different from those with full data (creating no bias), you’re not gaining anything by keeping those 72 people in the analysis.
Compare this to a study I also saw in consulting with 5 time points. Nearly all the participants had 4 out of the 5 observations. The missing data was pretty random–some participants missed time 1, others, time 4, etc. Only 6 people out of 150 had full data. Listwise deletion created a nightmare, leaving only 6 people in the data set.
Each person contributed data to 4 means, so each mean had a pretty reasonable sample size. Since the missingness was random, each mean was unbiased. Each subject fully contributed data and df to many of the mean comparisons.
With more than 2 time points and data that are missing at random, each subject can contribute to some change measurements. Keep that in mind the next time you design a study.
One of the most confusing things about mixed models arises from the way it’s coded in most statistical software. Of the ones I’ve used, only HLM sets it up differently and so this doesn’t apply.
But for the rest of them—SPSS, SAS, R’s lme and lmer, and Stata, the basic syntax requires the same pieces of information.
1. The dependent variable
2. The predictor variables for which to calculate fixed effects and whether those (more…)
Have you ever been told you need to run a mixed (aka: multilevel) model and been thrown off by all the new vocabulary?
It happened to me when I first started my statistical consulting job, oh so many years ago. I had learned mixed models in an ANOVA class, so I had a pretty good grasp on many of the concepts.
But when I started my job, SAS had just recently come out with Proc Mixed, and it was the first time I had to actually implement a true multilevel model. I was out of school, so I had to figure it out on the job.
And even with my background, I had a pretty steep learning curve to get to a point where it made sense. Sure, I was able to figure out the steps, but there are some pretty tricky situations and complicated designs out there.
To implement it well, you need a good understanding of the big picture, and how the small parts fit into it. (more…)
If you’ve ever worked with multilevel models, you know that they are an extension of linear models. For a researcher learning them, this is both good and bad news.
The good side is that many of the concepts, calculations, and results are familiar. The down side of the extension is that everything is more complicated in multilevel models.
This includes power and sample size calculations. (more…)
If you’ve ever done any sort of repeated measures analysis or mixed models, you’ve probably heard of the unstructured covariance matrix. They can be extremely useful, but they can also blow up a model if not used appropriately. In this article I will investigate some situations when they work well and some when they don’t work at all.
The Unstructured Covariance Matrix
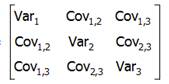 The easiest to understand, but most complex to estimate, type of covariance matrix is called an unstructured matrix. Unstructured means you’re not imposing any constraints on the values. For example, if we had a good theoretical justification that all variances were equal, we could impose that constraint and have to only estimate one variance value for every variance in the table.
But in an unstructured covariance matrix there are no constraints. Each (more…)
If you learned much about calculating power or sample sizes in your statistics classes, chances are, it was on something very, very simple, like a z-test.
But there are many design issues that affect power in a study that go way beyond a z-test. Like:
- repeated measures
- clustering of individuals
- blocking
- including covariates in a model
Regular sample size software can accommodate some of these issues, but not all. And there is just something wonderful about finding a tool that does just what you need it to.
Especially when it’s free.
Enter Optimal Design Plus Empirical Evidence software. (more…)