
Our analysis of linear regression focuses on parameter estimates, z-scores, p-values and confidence levels. Rarely in regression do we see a discussion of the estimates and F statistics given in the ANOVA table above the coefficients and p-values.
And yet, they tell you a lot about your model and your data. Understanding the parts of the table and what they tell you is important for anyone running any regression or ANOVA model.
(more…)
An “estimation command” in Stata is a generic term used for a command that runs a statistical model. Examples are regress, ANOVA, Poisson, logit, and mixed.
Stata has more than 100 estimation commands.
Creating the “best” model requires trying alternative models. There are a number of different model building approaches, but regardless of the strategy you take, you’re going to need to compare them.
Running all these models can generate a fair amount of output to compare and contrast. How can you view and keep track of all of the results?
You could scroll through the results window on your screen. But this method makes it difficult to compare differences.
You could copy and paste the results into a Word document or spreadsheet. Or better yet use the “esttab” command to output your results. But both of these require a number of time consuming steps.
But Stata makes it easy: my suggestion is to use the post-estimation command “estimates”.
What is a post-estimation command? A post-estimation command analyzes the stored results of an estimation command (regress, ANOVA, etc).
As long as you give each model a different name you can store countless results (Stata stores the results as temp files). You can then use post-estimation commands to dig deeper into the results of that specific estimation.
Here is an example. I will run four regression models to examine the impact several factors have on one’s mental health (Mental Composite Score). I will then store the results of each one.
regress MCS weeks_unemployed i.marital_status
estimates store model_1
regress MCS weeks_unemployed i.marital_status kids_in_house
estimates store model_2
regress MCS weeks_unemployed i.marital_status kids_in_house religious_attend
estimates store model_3
regress MCS weeks_unemployed i.marital_status kids_in_house religious_attend income
estimates store model_4
To view the results of the four models in one table my code can be as simple as:
estimates table model_1 model_2 model_3 model_4
But I want to format it so I use the following:
estimates table model_1 model_2 model_3 model_4, varlabel varwidth(25) b(%6.3f) /// star(0.05 0.01 0.001) stats(N r2_a)
Here are my results:
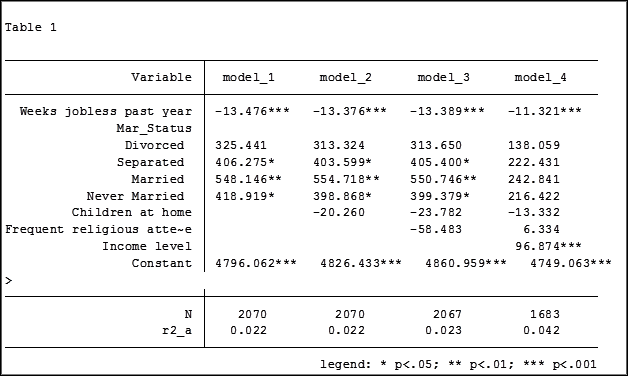
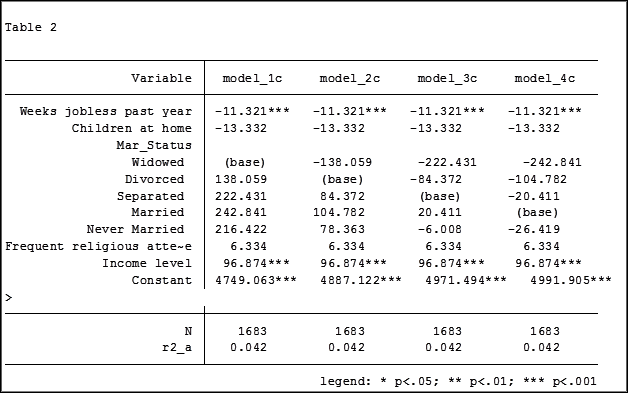
My base category for marital status was “widowed”. Is “widowed” the base category I want to use in my final analysis? I can easily re-run model 4, using a different reference group base category each time.
Putting the results into one table will make it easier for me to determine which category to use as the base.
Note in table 1 the size of the samples have changed from model 2 (2,070) to model 3 (2,067) to model 4 (1,682). In the next article we will explore how to use post-estimation data to use the same sample for each model.
Jeff Meyer is a statistical consultant with The Analysis Factor, a stats mentor for Statistically Speaking membership, and a workshop instructor. Read more about Jeff here.