
An “estimation command” in Stata is a generic term used for a command that runs a statistical model. Examples are regress, ANOVA, Poisson, logit, and mixed.
Stata has more than 100 estimation commands.
Creating the “best” model requires trying alternative models. There are a number of different model building approaches, but regardless of the strategy you take, you’re going to need to compare them.
Running all these models can generate a fair amount of output to compare and contrast. How can you view and keep track of all of the results?
You could scroll through the results window on your screen. But this method makes it difficult to compare differences.
You could copy and paste the results into a Word document or spreadsheet. Or better yet use the “esttab” command to output your results. But both of these require a number of time consuming steps.
But Stata makes it easy: my suggestion is to use the post-estimation command “estimates”.
What is a post-estimation command? A post-estimation command analyzes the stored results of an estimation command (regress, ANOVA, etc).
As long as you give each model a different name you can store countless results (Stata stores the results as temp files). You can then use post-estimation commands to dig deeper into the results of that specific estimation.
Here is an example. I will run four regression models to examine the impact several factors have on one’s mental health (Mental Composite Score). I will then store the results of each one.
regress MCS weeks_unemployed i.marital_status
estimates store model_1
regress MCS weeks_unemployed i.marital_status kids_in_house
estimates store model_2
regress MCS weeks_unemployed i.marital_status kids_in_house religious_attend
estimates store model_3
regress MCS weeks_unemployed i.marital_status kids_in_house religious_attend income
estimates store model_4
To view the results of the four models in one table my code can be as simple as:
estimates table model_1 model_2 model_3 model_4
But I want to format it so I use the following:
estimates table model_1 model_2 model_3 model_4, varlabel varwidth(25) b(%6.3f) /// star(0.05 0.01 0.001) stats(N r2_a)
Here are my results:
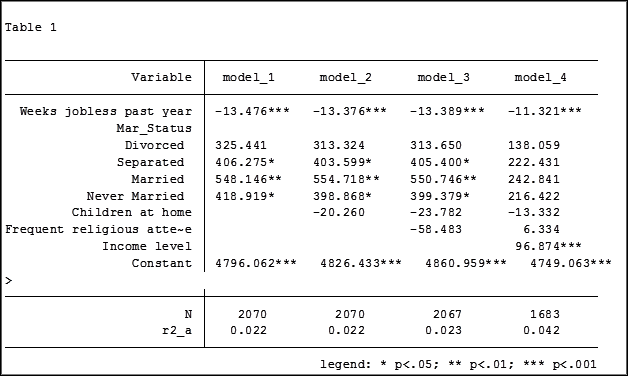
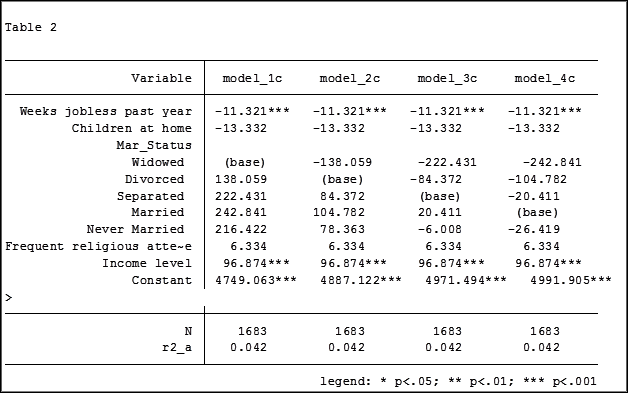
My base category for marital status was “widowed”. Is “widowed” the base category I want to use in my final analysis? I can easily re-run model 4, using a different reference group base category each time.
Putting the results into one table will make it easier for me to determine which category to use as the base.
Note in table 1 the size of the samples have changed from model 2 (2,070) to model 3 (2,067) to model 4 (1,682). In the next article we will explore how to use post-estimation data to use the same sample for each model.
Jeff Meyer is a statistical consultant with The Analysis Factor, a stats mentor for Statistically Speaking membership, and a workshop instructor. Read more about Jeff here.

Hi Jeff,
I am using the SEM command to run the regressions due to missing data and the use of the mlmv command and I’m having trouble finding an SEM mlmv post estimation command that will calculate the r-squared change as well as the significance of the r-squared change. Any guidance there?
Thank you for your time.
Hi Jeff,
How can i have a graph showing the trajectories in a repeated measurements with categorical exposure?
Hi Jeff,
Great!
When we run regression we get the coefficient in a table. All good! However, I am wondering how can I get the estimated equations.
My second query is: how can I run SUR, or statistically compare/test the coefficients in two models of same independent variables and different dependent variables?
Thanks!
Moksidul
Hi Moksidul,
You will have to create the estimated equations manually. Regarding SUR, Stata has a model to statistically compare models with the same independent variables and different outcome variables. The command is sureg. There are two examples of how to run these models in the Stata Base Reference Manual.
Jeff
Hi Jeff – great article!
I am able to get the table, however the /// star(0.05 0.01 0.001) stats(N r2_a) section of code generates an error, so I cant see the significance stars or stats beneath. I see the following on my screen:
. estimates table TR TRS TRSC TRSCCS TRSCCSi, varlabel varwidth(25) b(%6.3f) /// star(0.05 0.01 0.001) stats(N r2_a)
option / not allowed
r(198);
How do I fix this?
Thanks so much!!
Hi James,
Glad you found the article worthwhile. Is the text after the /// on the next line of your do-file? The three diagonal lines tells Stata that the code continues on the next line. If you want to have it all on the same line just remove the three diagonal lines.
Hope this solves your problem. I was able to run the code okay on my computer.
Jeff
Hello Jeff,
I am running a “xtpcse” (linear regression with panel-corrected standard errors, I am correcting for heteroscedasticity and autocorrelation.
I have two models with the same DV, in the second regression I take one of the IV’s from regression1 and I break it down into components. I want to check if there is a significant improvement in the model when the IV is broken down. I usually use the Vuong test (1989) for thsi but it doesn;t work after xtpcse, any suggestions?
Thanks
Hi,
Stata has removed the option for the Vuong test because it can give incorrect results.
Could you explain what you mean by breaking an IV into components.
Jeff
I ran three sets of multiple regression equations. The IVs are the same while the DVs are broken into quantity, quality and combined (quantity_quality using Principal Component Analysis). The R=squared and F-statistics of each of the three models are the same and p-values for each of the IVs in all the models are the same. However, the coefficients significantly differ across models for each variable though the direction of association (negative or positive) is the same across the models. My question is whether such estimation could be considered valid. Also, if I want to compare between the results, what do I do? Thank you.
Hi Ahmad, if you have different dependent variables for each model you don’t want (and can’t) compare results between models. Anytime you have different dependent variables you have a different research question. If you are interested in all three models you will need to discuss the impact that each predictor has on each outcome variable. The results from one model are independent from the results of a different model.
Dear Jeff,
I noticed some say that in logistic regressions, it’s possible to compare across models ( same set of independent variables, diff dependent variables as in different types/groups) by using predicted probability.
Hi, if you have two models and they have different outcome (dependent) variables you have different research questions and are testing different hypotheses. Doing a statistical analysis you begin with your research question and identify your outcome variable. The next step is to select your predictors. We can determine which models’ predictors are a better fit by running -2LL, AIC and BIC if they have the same outcome variable.
If in your analysis you have a few research questions you are attempting to solve you could look at each model’s ROC curves and compare them. But this is not generally the way that research is done.
Hi Jeff
Thanks for the explanation. what about the different tests and statistics (such as AR1, AR2, Sargan tests, R2, etc) of each estimations? how to add them all in the final table?
Thanks
Hi Balta,
The tests and statistics that you mention are from post estimation commands in Stata. The results shown in this article are extracting the results from the linear regression model.
My suggestion is, after running the post estimation command, use the command “ereturn list” to see what scalars are held in short term memory for that post estimation command. You might then be able to extract those by using the combination “estimates store” and “estimates table”. I have never tried doing that with post estimation commands.
Jeff
Excelent!, I have a 5 logistic models and need compare corrected classification between its, there is possible with this command?
Yes and no, you would use the “estimates” command as shown above but since you are using a logistic model (which uses maximum likelihood method) you would need to run a likelihood-ratio test to see which model is best. The command in Stata for the likelihood-ratio test is “lrtest”. The example above gives an adjusted r-square because it is a linear model.
Jeff Meyer