by Jeff Meyer
As mentioned in a previous post, there is a significant difference between truncated and censored data.
Truncated data eliminates observations from an analysis based on a maximum and/or minimum value for a variable.
Censored data has limits on the maximum and/or minimum value for a variable but includes all observations in the analysis.
As a result, the models for analysis of these data are different. (more…)
by Steve Simon, PhD
The Cox regression model has a fairly minimal set of assumptions, but how do you check those assumptions and what happens if those assumptions are not satisfied?
Non-proportional hazards
The proportional hazards assumption is so important to Cox regression that we often include it in the name (the Cox proportional hazards model). What it essentially means is that the ratio of the hazards for any two individuals is constant over time. They’re proportional. It involves logarithms and it’s a strange concept, so in this article, we’re going to show you how to tell if you don’t have it.
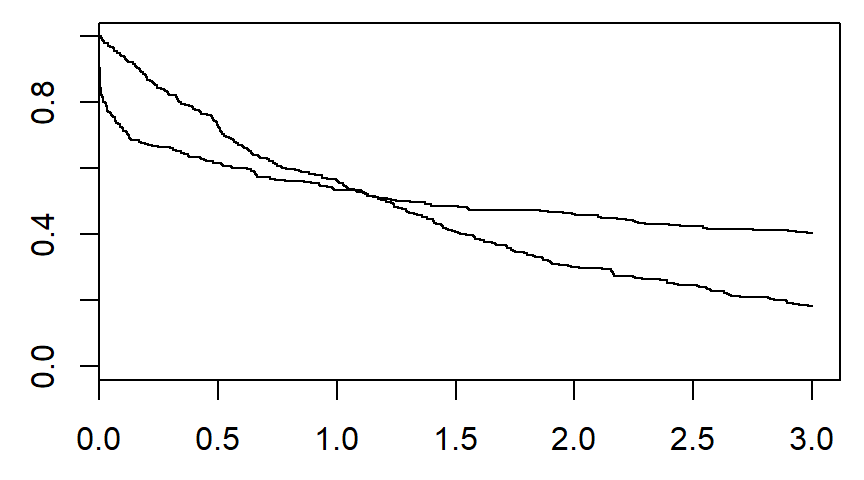
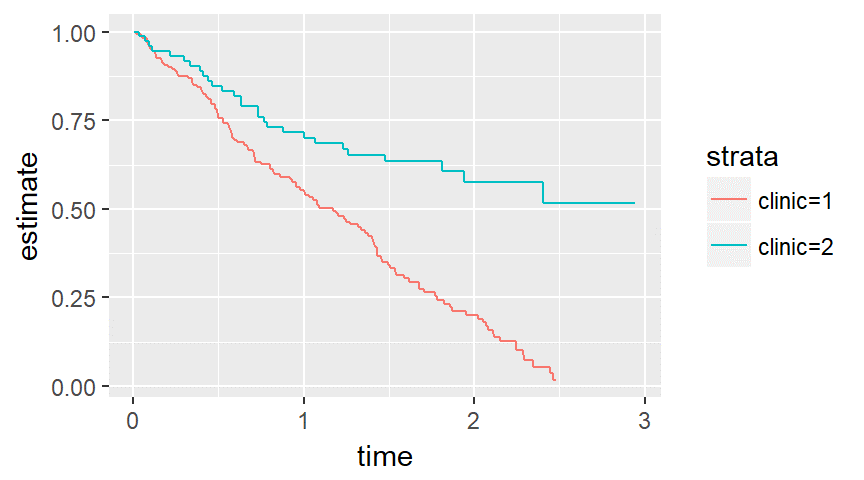
There are several graphical methods for spotting this violation, but the simplest is an examination of the Kaplan-Meier curves.
If the curves cross, as shown below, then you have a problem.
Likewise, if one curve levels off while the other drops to zero, you have a problem.
You can think of non-proportional hazards as an interaction of your independent variable with time. It means that you have to do more work in interpreting your model. If you ignore this problem, you may also experience a serious loss in power.
If you have evidence of non-proportional hazards, don’t despair. There are several fairly simple modifications to the Cox regression model that will work for you.
Nonlinear covariate relationships
The Cox model assumes that each variable makes a linear contribution to the model, but sometimes the relationship may be more complex.
You can diagnose this problem graphically using residual plots. The residual in a Cox regression model is not as simple to compute as the residual in linear regression, but you look for the same sort of pattern as in linear regression.
If you have a nonlinear relationship, you have several options that parallel your choices in a linear regression model.
Lack of independence
Lack of independence is not something that you have to wait to diagnose until your data is collected. Often it is something you are aware from the start because certain features of the design, such as centers in a multi-center study, are likely to produce correlated outcomes. These are the same issues that hound you with a linear regression model in a multi-center study.
There are several ways to account for lack of independence, but this is one problem you don’t want to ignore. An invalid model will ruin all your confidence intervals and p-values.
Often a model is not a simple process from a treatment or intervention to the outcome. In essence, the value of X does not always directly predict the value of Y.

Mediators can affect the relationship between X and Y. Moderators can affect the scale and magnitude of that relationship. And sometimes the mediators and moderators affect each other.

In a previous post , Using the Same Sample for Different Models in Stata, we examined how to use the same sample when comparing regression models. Using different samples in our models could lead to erroneous conclusions when interpreting results.
But excluding observations can also result in inaccurate results.
The coefficient for the variable “frequent religious attendance” was negative 58 in model 3 (more…)
Survival data models provide interpretation of data representing the time until an event occurs. In many situations, the event is death, but it can also represent the time to other bad events such as  cancer relapse or failure of a medical device. It can also be used to denote time to positive events such as pregnancy. Often patients are lost to follow-up prior to death, but you can still use the information about them while they were in your study to better estimate the survival probability over time.
This is done using the Kaplan-Meier curve, an approach developed by (more…)