• Skip to primary navigation
  • Skip to main content
  • Skip to primary sidebar
The Analysis Factor

The Analysis Factor

Statistical Consulting, Resources, and Statistics Workshops for Researchers

  • Home
  • About
    • Our Programs
    • Our Team
    • Our Core Values
    • Our Privacy Policy
    • Employment
    • Guest Instructors
  • Membership
    • Statistically Speaking Membership Program
    • Login
  • Workshops
    • Online Workshops
    • Login
  • Consulting
    • Statistical Consulting Services
    • Login
  • Free Webinars
  • Contact
  • Login

Using the Same Sample for Different Models in Stata

by Jeff Meyer Leave a Comment

by Jeff Meyer

In my last article, Hierarchical Regression in Stata: An Easy Method to Compare Model Results, I presented the following table which examined the impact several predictors have on one’ mental health.

nov2015b_image001

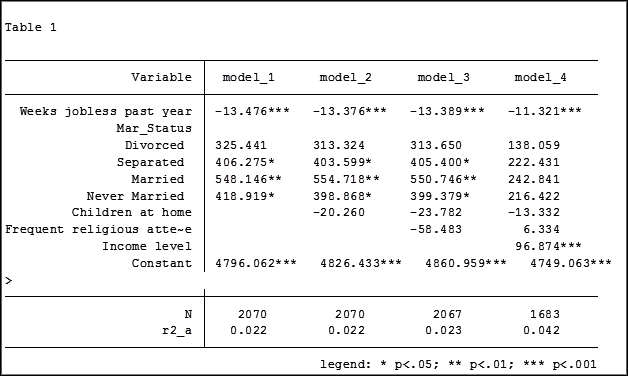
At the bottom of the table is the number of observations (N) contained within each sample.

The sample sizes are quite large. Does it really matter that they are different? The answer is absolutely yes.

Fortunately in Stata it is not a difficult process to use the same sample for all four models shown above.

Some background info:

As I have mentioned previously, Stata stores results in temp files. You don’t have to do anything to cause Stata to store these results, but if you’d like to use them, you need to know what they’re called.

To see what is stored after an estimation command, use the following code:
ereturn list

After a summary command:
return list

One of the stored results after an estimation command is the function e(sample). e(sample) returns a one column matrix.  If an observation is used in the estimation command it will have a value of 1 in this matrix. If it is not used it will have a value of 0.

Remember that the “stored” results are in temp files.  They will disappear the next time you run another estimation command.

The Steps

So how do I use the same sample for all my models? Follow these steps.

Using the regression example on mental health I determine which model has the fewest observations.  In this case it was model four.

I rerun the model:
regress MCS  weeks_unemployed   i.marital_status   kids_in_house  religious_attend    income

Next I use the generate command to create a new variable whose value is 1 if the observation was in the model and 0 if the observation was not. I will name the new variable “in_model_4”.
gen in_model_4 = e(sample)

Now I will re-run my four regressions and include only the observations that were used in model 4. I will store the models using different names so that I can compare them to the original models.

My commands to run the models are:

regress MCS  weeks_unemployed   i.marital_status  if  in_model_4==1
estimates store model_1a

regress MCS  weeks_unemployed   i.marital_status   kids_in_house  if  in_model_4==1
estimates store model_2a

regress MCS  weeks_unemployed   i.marital_status   kids_in_house   religious_attend if  in_model_4==1
estimates store model_3a

regress MCS  weeks_unemployed   i.marital_status   kids_in_house  religious_attend    income if  in_model_4==1
estimates store model_4a

Note: I could use the code  if  in_model_4 instead of if  in_model_4==1. Stata interprets dummy variables as 0 = false, 1 = true.

Here are the results comparing the original models (eg. Model_1) versus the models using the same sample (eg. Model_1a):

nov2015b_image002

nov2015b_image003

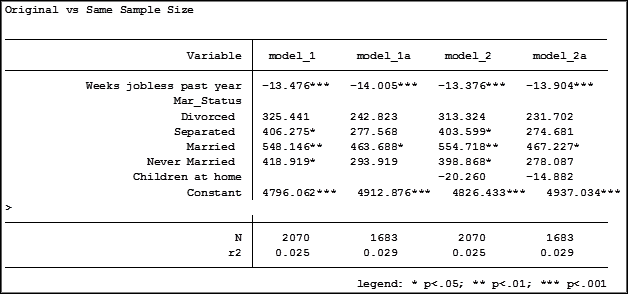
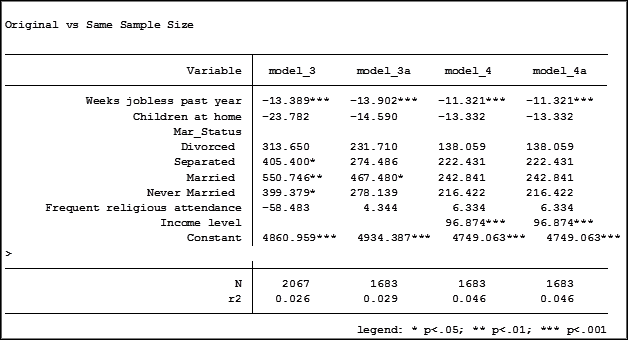
Comparing the original models 3 and 4 one would have assumed that the predictor variable “Income level” significantly impacted the coefficient of “Frequent religious attendance”. Its coefficient changed from -58.48 in model 3 to 6.33 in model 4.

That would have been the wrong assumption. That change is coefficient was not so much about any effect of the variable itself, but about the way it causes the sample to change via listwise deletion.  Using the same sample, the change in the coefficient between the two models is very small, moving from 4 to 6.
Bookmark and Share

Jeff Meyer is a statistical consultant with The Analysis Factor, a stats mentor for Statistically Speaking membership, and a workshop instructor. Read more about Jeff here.

Four Critical Steps in Building Linear Regression Models
While you’re worrying about which predictors to enter, you might be missing issues that have a big impact your analysis. This training will help you achieve more accurate results and a less-frustrating model building experience.

Tagged With: model, regress, samples, Stata

Related Posts

  • Linear Regression in Stata: Missing Data and the Stories it Might Tell
  • Hierarchical Regression in Stata: An Easy Method to Compare Model Results
  • Same Statistical Models, Different (and Confusing) Output Terms
  • Recoding a Variable from a Survey Question to Use in a Statistical Model

Reader Interactions

Leave a Reply Cancel reply

Your email address will not be published. Required fields are marked *

Please note that, due to the large number of comments submitted, any questions on problems related to a personal study/project will not be answered. We suggest joining Statistically Speaking, where you have access to a private forum and more resources 24/7.

Primary Sidebar

Free Webinars

Effect Size Statistics on Tuesday, Feb 2nd

This Month’s Statistically Speaking Live Training

  • January Member Training: A Gentle Introduction To Random Slopes In Multilevel Models

Upcoming Workshops

  • Logistic Regression for Binary, Ordinal, and Multinomial Outcomes (May 2021)
  • Introduction to Generalized Linear Mixed Models (May 2021)

Read Our Book


Data Analysis with SPSS
(4th Edition)

by Stephen Sweet and
Karen Grace-Martin

Statistical Resources by Topic

  • Fundamental Statistics
  • Effect Size Statistics, Power, and Sample Size Calculations
  • Analysis of Variance and Covariance
  • Linear Regression
  • Complex Surveys & Sampling
  • Count Regression Models
  • Logistic Regression
  • Missing Data
  • Mixed and Multilevel Models
  • Principal Component Analysis and Factor Analysis
  • Structural Equation Modeling
  • Survival Analysis and Event History Analysis
  • Data Analysis Practice and Skills
  • R
  • SPSS
  • Stata

Copyright © 2008–2021 The Analysis Factor, LLC. All rights reserved.
877-272-8096   Contact Us

The Analysis Factor uses cookies to ensure that we give you the best experience of our website. If you continue we assume that you consent to receive cookies on all websites from The Analysis Factor.
Continue Privacy Policy
Privacy & Cookies Policy

Privacy Overview

This website uses cookies to improve your experience while you navigate through the website. Out of these, the cookies that are categorized as necessary are stored on your browser as they are essential for the working of basic functionalities of the website. We also use third-party cookies that help us analyze and understand how you use this website. These cookies will be stored in your browser only with your consent. You also have the option to opt-out of these cookies. But opting out of some of these cookies may affect your browsing experience.
Necessary
Always Enabled

Necessary cookies are absolutely essential for the website to function properly. This category only includes cookies that ensures basic functionalities and security features of the website. These cookies do not store any personal information.

Non-necessary

Any cookies that may not be particularly necessary for the website to function and is used specifically to collect user personal data via analytics, ads, other embedded contents are termed as non-necessary cookies. It is mandatory to procure user consent prior to running these cookies on your website.