One big advantage of R is its breadth. If anything has been done in statistics, there is an R package that will do it.
The problem is that sometimes there are four packages that will do it. This is big problem with R (and with Python for that matter).
There are reviews done for R packages and if a package fails the review, it is kicked out. But this review does not compare to the reviews done for commercial packages like SAS, SPSS, or Stata.
SAS Institute might allow for a bit of overlap between proc anova, proc glm, and proc reg, for example, but nothing as close to the chaos of the multiple competing packages in R.
When you need something in R and you have to choose among multiple packages, what do you do? Here are some general thoughts about how to pick a package.
Start with the CRAN page
Start by finding the page on the Comprehensive R Archive Network (CRAN) associate with each package.
Look at when the package was first published and how often it has been updated. You’ll find this on the CRAN page under the “Old Sources” link. A package with multiple updates, especially very recent updates shows that the package author has spent a lot of time with the code.
For example, here’s some of the info you get for the psych package.
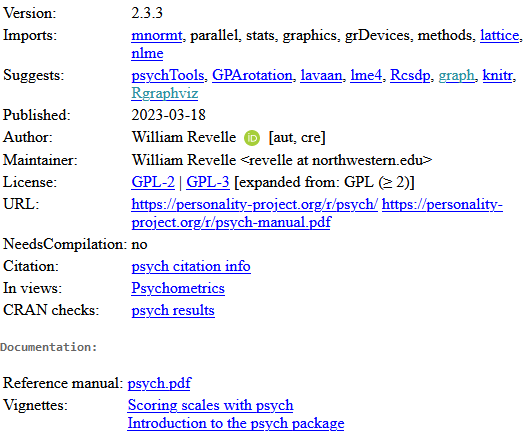
The CRAN page will list the author(s). Do you recognize any of the names? Certain authors, such as Frank Harrell, are well regarded in the statistics community and they are quite likely to publish a well-crafted package.
If you don’t recognize any of the names, do you recognize the institution from the author’s email address? Something from yale.edu is likely to be good, but maybe not something from gmail.com.
Read other sources about the package
Do the authors have a peer-reviewed publication associated with their package? Publishing in the Journal of Statistical Software or the R Journal is a sign that independent peer-reviewers liked the package enough to support a publication about it.
Google the author and see if they have a professionally written website that discusses their package in detail. Anyone who has invested the time in documenting their work on a separate website is probably someone who treats their package writing seriously.
Does the author offer one or more vignettes with their package? A vignette is a brief tutorial illustrating how to use a package with one or more real-world datasets. Like the separate website, a vignette is a sign of seriousness.
There’s an acronym in computer science, RTFM. The R, T, and M stand for “Read The Manual” but I’m not sure what the F stands for. In any case, the documentation for a package will sometimes mention other packages that you might be considering and will contrast the features in the author’s package versus features in the competing packages.
Task views
Finally, see if the package is described in one of CRAN’s task views. Task Views are independently maintained documents that briefly describe packages in a particular area like meta-analysis or time series. The maintainers of these Task Views try hard to be comprehensive and to offer a succinct overview of what each package does.
A personal example
I had to face this issue a few years ago when I needed an R package that would calculate Cronbach’s alpha. The package I chose, psych, had 44 updates at the time and it is still going strong (84 updates as of January 2023 with the most recent update in September of 2022).
I didn’t know the author, William Revelle, but the northwestern.edu domain for his email was reassuring.
There was no obvious peer-reviewed publication but there were links to two vignettes and a website. The other competing packages that I looked at had some of the features I was looking for, but not as many as I found for the psych package.
None of these criteria for judging a package are perfect by themselves. Don’t choose a package solely on the basis of its peer-reviewed publication and don’t reject a package out of hand just because the author uses a gmail address. Use all of these factors in aggregate to make your selection. And good luck!
by Steve Simon, Ph.D
Leave a Reply