Need to dummy code in a Cox regression model?
Interpret interactions in a logistic regression?
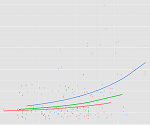
Add a quadratic term to a multilevel model?
 This is where statistical analysis starts to feel really hard. You’re combining two difficult issues into one.
You’re dealing with both a complicated modeling technique at Stage 3 (survival analysis, logistic regression, multilevel modeling) and tricky effects in the model (dummy coding, interactions, and quadratic terms).
The only way to figure it all out in a situation like that is to break it down into parts. (more…)
In my last blog post, I wrote about a mistake I once made when I didn’t realize the defaults for dummy coding were different in two SPSS procedures (Binary Logistic and GEE).
Ironically, about the same time I wrote it, I was having a conversation with Ann Maria de Mars on Twitter. She was trying to figure out why her logistic regression model fit results were identical in SAS Proc Logistic and SPSS Binary Logistic, but the coefficients in SAS were half those of SPSS.
It was ironic because I, of course, didn’t recognize it as the same issue and wasn’t much help.
But Ann Maria investigated and discovered that it came down to differences in the defaults for coding categorical predictors in SAS and SPSS that did it. Her detailed and humorous explanation is here.
Some takeaways for you, the researcher and data analyst:
1. Give yourself a break if you hit a snag. Even very experienced data analysts, statisticians who understand what they’re doing, get stumped sometimes. Don’t ever think that performing data analysis is an IQ test. You’re bringing together many skills and complex tools.
2. Learn thy software. In my last post, I phrased it “Know thy software”, but this is where you get to know it. Snags are good opportunities to investigate the details of your software, just like Ann Maria did. If you can think of it as a challenge to figure out–a puzzle–it can actually be fun.
Make friends with your syntax manuals.
3. Get help when you need it. Statistical software packages *are* complex tools. You don’t have to know everything to use them
Ask colleagues. Call customer support. Call a stat consultant. That’s what they’re there for.
4. A great way to check your work is to run your test two different ways. It’s another reason to be able to use at least two stat software packages. I’m not suggesting you have to run every analysis twice. But when a result looks strange, or you want to double-check a specific important model, this can be a good strategy for testing things out.
It may be that your results aren’t telling you what you think they are.
[Logistic_Regression_Workshop]
One of the tricky parts about dummy coded (0/1) variables is keeping track of what’s a 0 and what’s a 1.
This is made particularly tricky because sometimes your software switches them on you.
Here’s one example in a question I received recently. The context was a Linear Mixed Model, but this can happen in other procedures as well.
I dummy code my categorical variables “0” or “1” but for some reason in the (more…)
 Model Building–choosing predictors–is one of those skills in statistics that is difficult to teach. It’s hard to lay out the steps, because at each step, you have to evaluate the situation and make decisions on the next step.
If you’re running purely predictive models, and the relationships among the variables aren’t the focus, it’s much easier. Go ahead and run a stepwise regression model. Let the data give you the best prediction.
But if the point is to answer a research question that describes relationships, you’re going to have to get your hands dirty.
It’s easy to say “use theory” or “test your research question” but that ignores a lot of practical issues. Like the fact that you may have 10 different variables that all measure the same theoretical construct, and it’s not clear which one to use. (more…)
Q: Do most high impact journals require authors to state which method has been used on missing data?
I don’t usually get far enough in the publishing process to read journal requirements.
But based on my conversations with researchers who both review articles for journals and who deal with reviewers’ comments, I can offer this response.
I would be shocked if journal editors at top journals didn’t want information about the missing data technique. If you leave it out, they’ll either assume you didn’t have missing data or are using defaults like listwise deletion. (more…)
Here’s a little SPSS tip.
When you create new variables, whether it’s through the Recode, Compute, or some other command, you need to check that it worked the way you think it did.
(As an aside, I hope this goes without saying, but never, never, never, never use Recode into Same Variable. Always Recode into Different Variable so you don’t overwrite your data and then discover you made a mistake. Or worse, not discover. It happens).
And the easiest way to do that is to simply look at the data. (more…)